It gives a different picture of brain rhythms from the power spectrum
T.H. Bullock, J.T. Enright and K.M. Chong
Editorial Correspondence:
Theodore H. Bullock
Neurobiology Unit,
0201 Scripps Institution of Oceanography
University of California San Diego
La Jolla, CA 92093-0201
tel. (619) 534-3636; fax (619) 534-3919 E-mail: tbullock@ucsd.edu
The most information-rich measure of the working brain is the electrical activity, recorded as wideband, extracellular local field potentials from multiple sites, in extent and depth, with millisecond and millimeter resolution. We still lack a common view of the electrical activity in terms of simple description - which must precede explanation in terms of mechanisms. The situation is much like the diverse views on the nature and characteristics of a jungle. We have elsewhere addressed related questions. (i) How much of the wideband activity is stochastic - concluding that a significant and highly labile amount of coherence and bicoherence bespeak temporal fine structure and cooperativity. (ii) How much fine structure is spatial, concluding that differentiation increases as the volume sampled is smaller (Bullock et al. 1995a,b, 1997).
Spectacular advances in MRI, PET, 2DG and other ways of imaging the working brain can tell us where some of the regions relevant to a given task or state are - by an increase in blood flow, metabolism or some particular sign during subtle and sophisticated behavioral situations. Optical methods can reveal signs of activity at hundreds of pixels in a few square millimeters of exposed surfaces, sometimes even without temporal averaging. Electrical recording is not just another measure; and the methodology is still advancing in each dimension - from single units and from compound vector sums of assemblies of cells, from all-or-none spikes to subthreshold, graded and local shifts, with relatively high signal-to-noise ratios and high dynamic ranges, from many dozens to scores of loci as close together as 100 micrometers. The battery of tools at hand continues to expand, for analyses of power, phase and coherence spectra (simple, partial and multiple), current sources and sinks, magnetic moments, wavelets, mutual information, nonlinear bispectrum and bicoherence, dimensional estimates, independent components, patterns in time and space and other features.
There is little agreement even on a first order description of the activity in time and in space, including the ongoing microelectro- encephalogram (microEEG) and the stimulus- bound changes called the "evoked potential" (EP), or the situation-dependent, relatively endogenous "event-related potential" (ERP) of cortical and subcortical assemblages of cells. Is classifying by frequency bands adequate and heuristic or does it channel our thinking? Our working models of brain activity may be unrealistically influenced by the convenience of linear spectral analysis. We here address one seemingly simple aspect of description. How much of the local field potential in the brain is rhythmic? The aim of this paper is to assess and report on a wide variety of samples of recorded ongoing brain activity with respect to a more rigorous method of detecting rhythmicity than the usual Fourier analysis and power spectrum, namely an additive periodogram which is capable of revealing oscillations buried in nonrhythmic, wideband fluctuations, even when we have no idea of the prevailing period and even when there is more than one independent rhythm.
First we shall have to address the question of definition: when or what is a rhythm? We will use oscillation and rhythm as equivalent. Their essence is regular repetition at some period and the essence of the definition is how regular. This depends on the context (music, business cycles, biological clocks). We will assume that the context of alternating swings of brain potentials is quite tolerant of fluctuations, so that the coefficient of variation (CV = standard deviation of periods / mean period) is commonly 0.1-0.2 but can be as much as 0.3-0.4 (fluctuations of period up to 30-40% of the mean) in some situations and we might still speak of a crude oscillation or a rough rhythm. These are subjective values, representing our impression of usage in the literature, accepted as reasonable. They will guide the search and its methods, reported below.
The more difficult boundary is that between a single rhythm and a sliding or regularly modulated rhythm. A step or ramped change from one to another maintained frequency signifies two rhythms. A small amplitude FM or drift (tremulo or accelerando) might be thought of as a rhythm. Larger modulations, regular or episodic, are perhaps better thought of as something else than a rhythm or an oscillation, like sliding up or down the scale (glissando). There is little basis for choosing the necessarily arbitrary boundary between a slowly or slightly drifting rhythm and a rapid or larger frequency modulation that should not be designated a rhythm. We have chosen analysis epochs of five seconds which means, based on the foregoing, arbitrary limit, that if an oscillator drifts or modulates more than +/- 30% of its mean within 5 s, it will be considered as borderline nonrhythmic or not a single rhythm. Thus fluctuations from 7 to 13 Hz will be considered rhythmic if the FM is smoothly monotonic and slow enough to require 5 s for one pass but not if it is more rapid or jittery.
The additive periodogram cuts the whole time series (here 5 s) on an arbitrary period, adds and averages all these segments; repeats this for all possible periods within the chosen range and resolution; then takes the standard deviation of each average and plots these against the period or its reciprocal, frequency, making a spectrum of the strength of each possible period. Enright (1965) programmed the classical additive periodogram and used the method to look for circadian periods. We have extended it to search over the spectrum from 20 to 333 ms periods (3-50 Hz), in four ranges of resolution, from 0.2 to 2 ms, and applied it to many 5 s samples of microEEG and of artificial time series of known content. This procedure shows all periodic events in a time series, of whatever shape or phase, without making Fourier assumptions of stationarity, linearity or sinusoidal components. Whereas the method, as extended, detects multiple rhythms within the wide band, it has the complication that each rhythm makes a peak not only at its fundamental frequency but also at all subharmonic periods; in some cases special steps are necessary to determine the fundamental. The confidence level varies with the period, by the number of cycles at that period that are permitted in the sample length. Hence, with our wide band (4 octaves) confidence is low at low frequencies when we use a fixed sample length for all periods. Controls with stochastic time series are important and it remains for experience to evaluate, for example, the influence of high amplitude transients that repeat only a few times within the sample length
Periodograms of both stochastic time series and microEEGs show extensive agreement with power spectra and frequent disagreement in the position and relative amplitude of peaks. Periodograms display some peaks (i.e. possibly significant rhythms, above the expectation from a stochastic time series of the same length) where the power spectrum, based on the Fourier transform, does not. Power spectra display some peaks where the periodogram does not (i.e. no rhythmic waveform exists at this period). Periodograms of known time series with pure rhythms buried in white or pink noise whose amplitude is sufficient to hide the rhythms in raw V/t plots show the rhythms when RMS signal to noise is <1:5. They detect artificial rhythms degraded by frequency modulation as much as 85% (e.g. 7-13 Hz or 25-45 Hz), although the peaks are greatly lowered and noise-sensitive. For 20% FM they are quite useful. Choosing somewhat coarser resolution may improve utility.
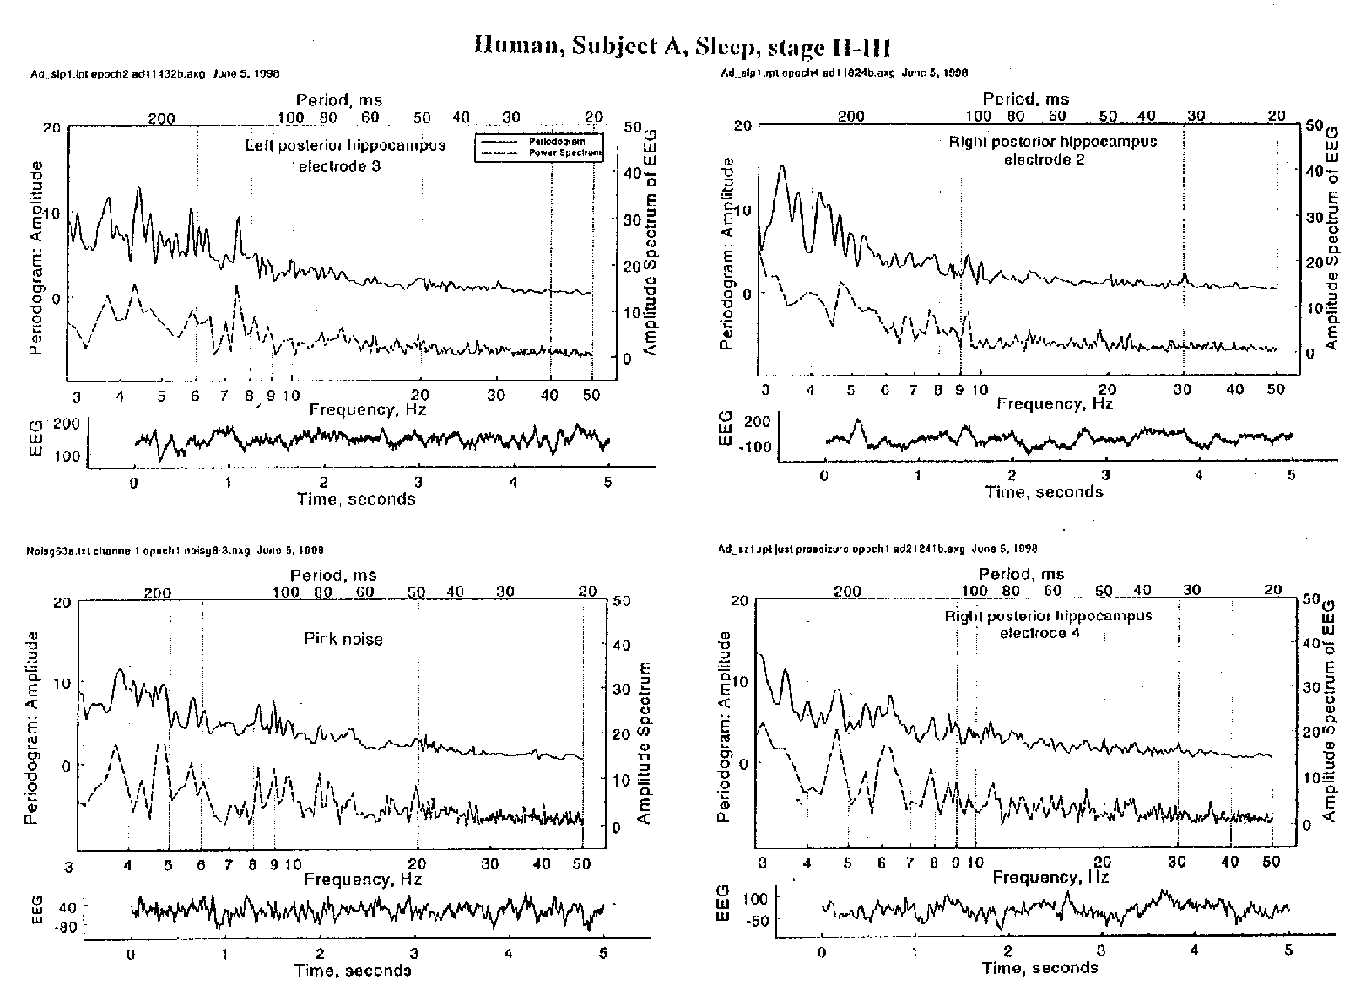
The microEEG samples here reported (Fig.1) are subdural and depth recordings from epileptic patients in sleep, alertness and seizures, as well as epidural records from rabbits in high-amplitude-slow and low-amplitude-fast as well as high-amplitude-theta states. Although many of the power spectrum peaks also appear in the periodogram, some power spectrum peaks prove to be non-rhythmic, according to periodogram analysis, even with a generous definition in respect to wobble, drift or modulation. Significant rhythms are rare in intracranial human EEG, under hospital ward conditions, i.e. without the eyes closed, non- dozing, non-thinking condition for classical alpha or the other defined states for alpha, sensu latu, and beta and gamma rhythms. Most peaks in both spectra are usually not consistent in successive 5 s epochs.
Most of the intracranial EEG (largely local field potentials), most of the time, consists less of sinusoidal oscillations than of irregularly repeating events of broad band or having many harmonics. The power spectrum is an unreliable way to identify rhythms. Aided by grants to THB from the National Institute for Neurological Diseases and Stroke, NIH, and the Charles Robins Family Foundation.
References
Bullock TH, McClune MC, Achimowicz JZ, Iragui- Madoz VJ, Duckrow RB, Spencer SS 1995a EEG coherence has structure in the millimeter domain: subdural and hippocampal recordings from epileptic patients. EEG Clin Neurophysiol 95:161-177.
Bullock TH, McClune MC, Achimowicz JZ, Iragui- Madoz VJ, Duckrow RB, Spencer SS 1995b Temporal fluctuations in coherence of brain waves. Proc Natl Acad Sci 92:11568-11572.
Bullock, T.H., Achimowicz, J.Z., Duckrow, R.B., Spencer, S.S., Iragui-Madoz, V.J. 1997 Bicoherence of intracranial EEG in sleep, wakefulness and seizures. EEG Clin Neurophysiol 103:661-678
Enright, J.T. 1965 The search for rhythmicity in bio- logical time-series. J.Theoret.Biol. 8:426-468.
Comparison of periodogram and power spectrum in each of three deep temporal loci and a stochastic control. Lpt & rpt, channels 2, 3 & 4 are three electrode contacts in left and right posterior hippocampus of a sleeping epileptic patient, in 5 s segments of an EEG recording. The stochastic control is a time series made from white noise filtered with 12 db per octave cut off downwards from 1 Hz and upwards from 4 Hz, to simulate the power spectrum of EEG; voltage was made approximately equal to some samples of EEG. The raw voltage vs time record is shown below each panel. Power spectra are the dashed curves, positioned just below the solid-line periodograms, which are slightly smoothed. Note the extensive agreement and the frequent disagreement between the two spectra. Both show few peaks rising above the level seen with stochastic data and most of the peaks are not consistent between consecutive 5 s segments (not shown here). Note the occasional peaks in each spectrum that do not have a counterpart in the other.