Differences in the ability to process a visuo-spatial task are reflected in event-related slow cortical potentials of human subjects
Claus Lamm*, Herbert Bauer, Oliver Vitouch, Reinhard Gstättner
Brain Research Laboratory, Department of Psychology, University of Vienna, Liebiggasse 5, A-1010 Vienna, Austria
Published in
Neuroscience Letters, 269, 137-140, 1999
*Corresponding author. Tel.: +43-1-427747829; fax: +43-1-427747859;
e-mail: Claus.Lamm@univie.ac.at
Abstract:
Recent Positron Emission (PET) and EEG studies suggest that higher ability in a cognitive task is associated with a more efficient neuronal processing of this task. However, the validity and generalizability of these studies is limited for several reasons.
We investigated 20 male and 18 female human subjects with good vs. poor spatial ability performing a visuo-spatial task (cube test). Processing-related slow event-related potentials were recorded via 22 electrodes, evenly distributed over the scalp.
Significant differences between good and poor performers were found in both sexes: Poor subjects showed higher activity in the parietal region, and their topography was more extended into fronto-central regions. Since the amount and topography of brain activity may vary considerably depending on subjects' ability, we conclude that careful (experimental) control of task-specific ability of subjects is mandatory for cognitive neuroscience studies.
Keywords:
neuronal efficiency; ability; spatial cognition; individual differences; event-related potentials; slow potentials; human cognition
Having already been introduced in 1969 [4], the concept of neuronal efficiency assumes that higher ability in a cognitive task is associated with more efficient neuronal processing of this task. Several functional neuroimaging studies have led to revitalized speculations about this assumption. Positron Emission Tomography (PET) studies report positive correlations between ability and the decrease in glucose metabolic rate (GMR) following training of a visuo-spatial/motor task [7], and negative correlations with GMR during the processing of abstract reasoning [8] and verbal fluency items [11]. Topographical recordings of slow potential shifts (SPSs) in good and poor spatial test performers, revealed less slow potential negativity in the good group over the left parieto-occipito-temporal region [14]. In subjects with higher reasoning scores (Raven test), less Event Related Desynchronisation, following presentation of a sentence verification task, was reported [10]. However, the generalizability of these studies is restricted for several reasons. In the PET studies, sample sizes were rather low, and no control group was investigated in the training study. In the EEG studies, the division between good and poor performers was accomplished only by means of a post-hoc median split. Also, group assignment was based on ability measures derived from tasks which were only correlated with, but not identical to those used during electrophysiological recordings. Furthermore, of all studies cited so far, only one [11] investigated male and female subjects, but no sex-specific analyses were reported. Another PET study [6] which also investigated both sexes shows no correlation between ability and GMR in females during mathematical reasoning, but an inconsistent positive one in males. However, the per-group sample size in this study was again rather low, the 'low' ability group was defined via an average math ability, and groups also differed in their verbal ability.
Using the method of Slow Potential Topography [2], we aimed to investigate whether the assumption of more efficient processing of a visuo-spatial task in high ability subjects holds for both sexes. Spatial ability was chosen since sex differences in this intellectual dimension are well documented on in literature [17]. In two consecutive studies, males [16] and females with different levels of ability were investigated. In both experiments, a more sensitive separation of ability groups was achieved by pre-experimental selection of subjects whose test performance fell either in the first (poor performers) or in the fourth quartile (good performers) of the respective test calibration sample. In order to keep single trials short, the visuo-spatial task that subjects had to process during EEG recordings was dichotomized (see Fig. 1), but in all other aspects identical to the one version used for pre-selection (3 Dimensional Cube test 3DC [5]). Since the 3DC fulfills the criteria of the Rasch model [13], it has the property of unidimensionality and therefore measures the same latent cognitive dimension (ability) in different groups of subjects. This property was essential for our study since we wanted to ensure that behavioral differences between groups and sexes were based on 'true' differences in spatial processing, and not on differences in processing strategies or other factors not attributable to spatial cognition.
Altogether, thirty-eight healthy right-handed [1] students aged 20 to 30 years participated in the two experiments (Male: good-poor=12/8; Female: good/poor =10/8). Extreme groups and sexes neither differed in age nor in their general verbal ability and basic intelligence (tested using a brief word-power test [15]; see table 1). During the experiment, subjects were seated in a dimmed and sound-attenuated room. They had to process visuo-spatial items for a period of 30 minutes (in a separate experimental condition, they solved verbal reasoning tasks; only the results of the spatial condition are reported in this paper). Items appeared 2 sec after pressing of a start button. Subjects had to decide whether two blue-painted cubes with white patterns on their faces presented in the middle of a 17¢ ¢ color computer screen placed about 70 cm in front of them could be identical or not (answers 'yes' or 'no'). This comparison required the mental rotation and/or transformation of one of the cubes. Since a speeded (computer-paced) item presentation mode is known to affect unidimensionality, item presentation time was unrestricted. Starting with the button push until the response of the item, EEG was recorded via 22 Ag/AgCl electrodes evenly distributed over the scalp. Electrodes were mounted on small adapters, and the skin was scratched at each location using a sterile needle to minimize skin potential artifacts and to keep electrode impedance £ 1 kW . Adapters had been secured on the scalp via collodion with the help of an application cap [2], yielding a 2 + 4 x 5 equidistant matrix montage. While the positions on the median sagittal line corresponded exactly to those of the international 10-20 system, the other ones only approximated them due to the equidistance constraint (recording locations: Fp1', Fp2' / F7', F3', Fz, F4', F8' / T3', C3', Cz, C4', T4' / T5', P3', Pz, P4', T6' / O7', O3', Oz, O4', O8'; all referenced to linked mastoids). Electrodes and adapters were filled with degassed electrolyte and - via a preamplifier - connected to a high input impedance (³ 100 GW ) DC amplifier with excellent baseline stability. EEG was sampled at 4 kHz (downsampling at 250 Hz for digital storage), and the frequency range was set from DC to 100 Hz (notch at 50 Hz). In order to control eye movement artifacts, vertical (electrodes above and below the right eye) and horizontal electrooculogram (electrodes on the outer canthi) were recorded bipolarly. After EOG correction using a linear regression algorithm (see [16]), all trials (N=76 per subject on the average) were visually inspected, and those assessed to contain artifacts were excluded from further analyses. For all trials solved correctly, stimulus onset-related averages referenced to a 200 msec pre-stimulus baseline were computed for each subject, and topographical SPS amplitudes and their current source density transforms were mapped by means of a spherical-spline interpolation algorithm [12]. For statistical analyses, 7 measures representing SPSs at different latencies were calculated. These measures consisted of the mean DC amplitude in a 200 msec interval centered around 1.9, 2.4, 2.9, 3.4, 3.9, 4.4 and 4.9 sec after stimulus onset. Since the same statistical results (in terms of significance level) were observed for all SPSs measures, only the results of the analyses at 4.9 sec will be reported on here. Greenhouse-Geisser corrected repeated-measures ANOVAs with factors: sex (2 levels), group (2) and location (22) which were computed for raw amplitude and z-normalized [9] values. Global ANOVA results were evaluated in detail by six Bonferroni-corrected linear contrasts (adjusted a-level a' =.009) using specific error variances [3].
Behavioral data are reported in table 1. As for the SPS data, the ANOVA with raw amplitudes revealed significant main effects: sex [F(1,34)=11.26, p=.002], group [F(1,34)=10.39, p=.003)] and location [F(21,714)=91.16, e =.24, p<.001], significant interactions sex x location [F(21,714)=2.91, e =.24, p=.015] and group x location [F(21,714)=4.57, e =.24, p<.001], and a 3-way interaction that was not significant [F(21,714)=.73, e =.24, p=.606]. Linear contrasts (sexes pooled) revealed significantly higher negative amplitudes in the poor group for the fronto-medial [F3', Fz, F4'; F(1,34)=14.78, p<.001, mean amplitude difference D =-7.68 m V ], the frontal [Fp1' to F8'; F(1,34)=12.84, p=.001, D =-10.42 m V], the central [C3', Cz, C4'; F(1,34)=15.16, p<.001, D =-8.39 m V] and the parietal region [P3', Pz, P4'; F(1,34)=11.25, p=.002, D =-7.15 m V). No significance was observed for temporal (T3', T4', T5', T6') and occipital (O7' to O8') sites. Similar results were obtained if contrasts were calculated separately for males and females (significant differences in parietal, frontal and central regions and no significant temporal or occipital contrasts in either sexes). Using normalized values, the main effect location [F(21,714)=121.34, e =.26, p<.001] and the interaction group x location were significant [F(21,714)=5.56, e =.26, p<.001], while sex x location [F(21,714)=2.08, e =.26, p=.062] and group x sex x location [F(21,714)=.97, e =.26, p=.445] did not reach significance (a =.05).
The corresponding SPSs waveforms, along with single-latency topographical mappings of the value centered around 4.9 sec, are displayed in Fig. 2. In both groups and sexes, activity patterns are dominated parieto-occipitally, i.e. by a region which is typically attributed to the processing of spatial information. However, the poor group shows substantially more slow potential negativity in this area, and their topography is also more extended into the fronto-central region.
The significant interaction group x location indicates that the ability differences in the amount of cortical activity are not restricted to either of the sexes. This interpretation is not contradicted by the significance of the sex x location interaction as the three-way interaction is not significant: Thus, the two-way interaction only indicates a location-specific sex difference (which cannot be handled in detail here) in spatial processing which is independent of group membership. The generalizability of the group differences is additionally validated by the significance of the linear contrasts when computed for separated samples. Our findings do not only indicate that males and females of the poor group show enhanced activity in item-processing regions, but also that wider and more distributed cortical activities may be observed during task processing in these subjects. This is shown by the analyses using normalized values, revealing differences in topographic activity between the two groups, and by the linear contrasts, indicating activity differences in the frontal and central area. Also, only poor subjects showed negative potentials at fronto-medial sites, while good ones did not. This suggests that this cortical region is involved in task processing only in the poor group.
The time windows used for analyses were identical for both groups. Thus, it might be argued that different stages of cognitive processing were compared between groups. As already noted, the same statistical results were observed for all nine time windows, reflecting the time course of the SPSs patterns: In both groups, starting from 2 sec after stimulus onset, gradually increasing amplitudes, but almost no changes in topographies were observed. Also, at no point in time did we observe a topography identical to the one of the other group at a different point in time. Hence, it seems plausible that cognitive processing is different between groups over the whole interval of task processing.
As we analyzed SPS amplitudes relative to a stimulus onset-baseline, the smaller amplitudes in good performers may alternatively be explained by a specific pre-activation of those cortical regions which are crucial for task-specific processing. In order to exclude this interpretation, we also analyzed pre-stimulus baseline amplitudes (mean interval 200 ms before stimulus onset). No significant group effect, nor any significant interaction including the factor group could be observed, nor was any significance obtained using normalized data. Although our study supports the neuronal efficiency assumption, further - and especially longitudinal - studies will be required to analyze the causal directionality of the relationship between ability and brain activity. For the moment, based on the evidence that the amount and even the localization of cortical activity varies with subjects' performance levels, we conclude that, with subjects too qualified or too well-trained, task-relevant cortical resources may not or only partly become engaged. Thus, an important caveat for functional studies of cognitive processing has to be raised, namely to (experimentally) control the task-specific ability of subjects.
[1] Annett, M., Left, right, hand, and brain: the right shift theory, Erlbaum, London, 1985.
[2] Bauer, H., Slow Potential Topography, Behavior Research Methods, Instruments, and Computers, 30 (1998)
20-33.
[3] Boik, R.J., A priori tests in repeated measures designs: effects of nonsphericity, Psychometrika, 46 (1981) 241-
255.
[4] Ertl, J. and Schafer, E., Brain response correlates of psychometric intelligence, Nature, 223 (1969) 421-422.
[5] Gittler, G., Dreidimensionaler Würfeltest (3DW): Ein Rasch-skalierter Test zur Messung des räumlichen
Vorstellungsvermögens, Theoretische Grundlagen und Manual, Beltz Test, Weinheim, 1990.
[6] Haier, R.J. and Benbow, C.P., Sex differences and lateralization in temporal lobe glucose metabolism during
mathematical reasoning, Developmental Neuropsychol., 11 (1995) 405-414.
[7] Haier, R. J., Siegel, B., MacLachlan, A., Soderling, E., Lottenberg, S. and Buchsbaum, M. S., Regional glucose
metabolic changes after learning a complex visuospatial/motor task: a positron emission tomographic study, Brain Research, 570 (1992) 134-143.
[8] Haier, R.J., Siegel, B., Nuechterlein, K.H., Hazlett, E., Wu, J.C., Paek, J., Browning, H.L. and Buchsbaum,
M.S., Cortical glucose metabolic rate correlates of abstract reasoning and attention studied with positron emission tomography, Intelligence, 12 (1988) 199-217.
[9] Haig, A.R., Gordon, E. and Hook, S., To scale or not to scale: McCarthy and Wood revisited, Electroenceph.
clin. Neurophysiol., 103 (1997) 323-325.
[10] Neubauer, A., Freudenthaler, H.H. and Pfurtscheller, G., Intelligence and spatiotemporal patterns of event
related desynchronisation, Intelligence, 20 (1995) 249-266.
[11] Parks, R.W., Loewenstein, D.A., Dodrill, K.L., Barker, W.W., Joshii, F., Chang, J.Y., Emran, A., Apicella, A.,
Sheramata, W.A. and Duara, R., Cerebral metabolic effects of a verbal fluency test: a PET scan study, J. Clin. Exp. Neuropsychol., 10 (1988) 565-575.
[12] Perrin, F., Pernier, J., Bertrand, O. and Echallier, J.F., Spherical splines for scalp potential and current source
density mapping, Electroenceph. clin. Neurophysiol., 72 (1989) 184-187.
[13] Rasch, G., Probabilistic models for some intelligence and attainment tests, The University of Chicago Press,
Chicago, 1980 (originally published 1960 in Danish).
[14] Rösler, F., Heil, M., Bajric, J., Pauls, A.C. and Hennighausen, E., Patterns of cerebral activation while mental
images are rotated and changed in size, Psychophysiology, 32 (1995) 135-49.
[15] Schmidt, K.H. and Metzler, P., Wortschatztest (WST), Beltz Test, Weinheim, 1992.
[16] Vitouch, O., Bauer, H., Gittler, G., Leodolter, M. and Leodolter U., Cortical activity of good and poor spatial
test performers during spatial and verbal processing studied with Slow Potential Topography, Int. J. Psychophysiol., 27 (1997) 183-199.
[17] Voyer, D., Voyer, S. and Bryden, M.P., Magnitude of sex differences in spatial abilities: a meta-analysis and
consideration of critical variables, Psychol. Bull., 117 (1995) 250-270.
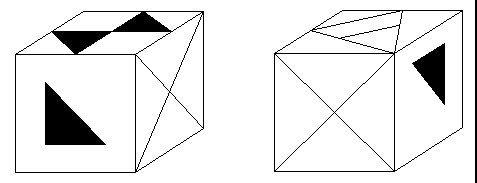
Fig. 1: Black/White sample of a dichotomized 3DC item. Correct answer: 'yes' (i.e., the two cubes could be identical).
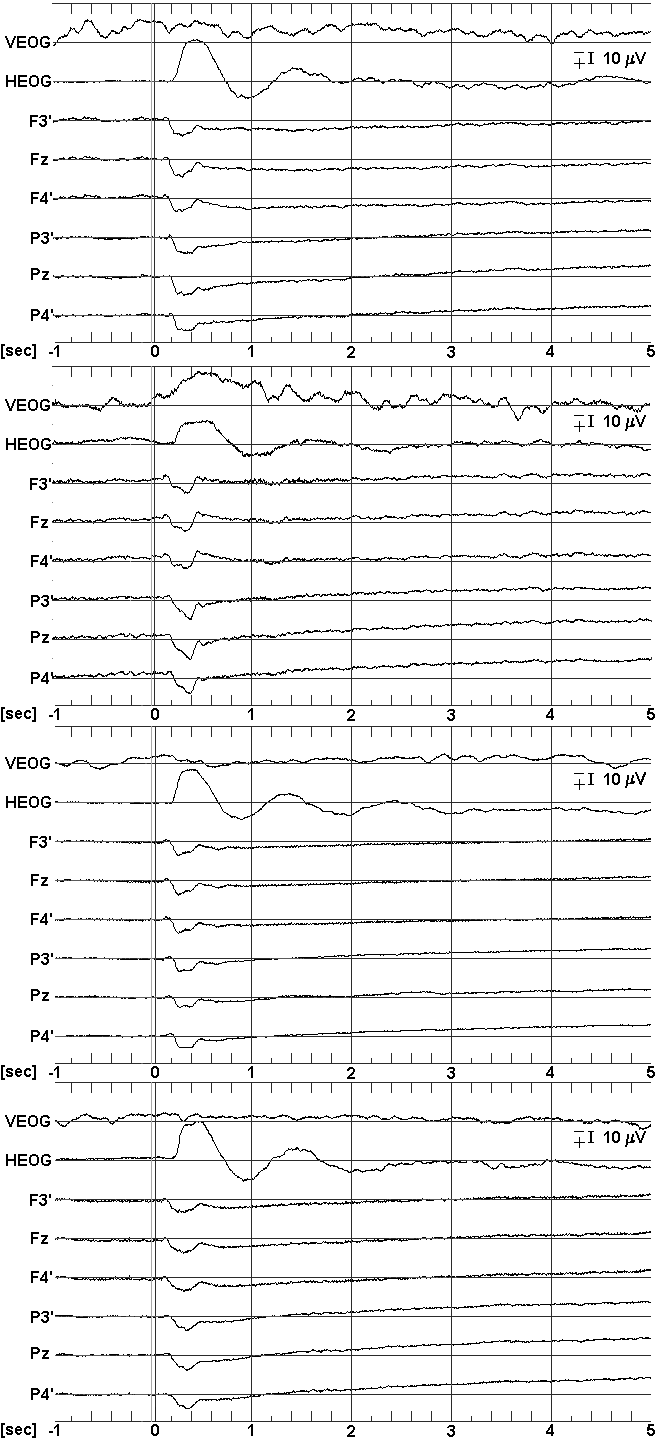
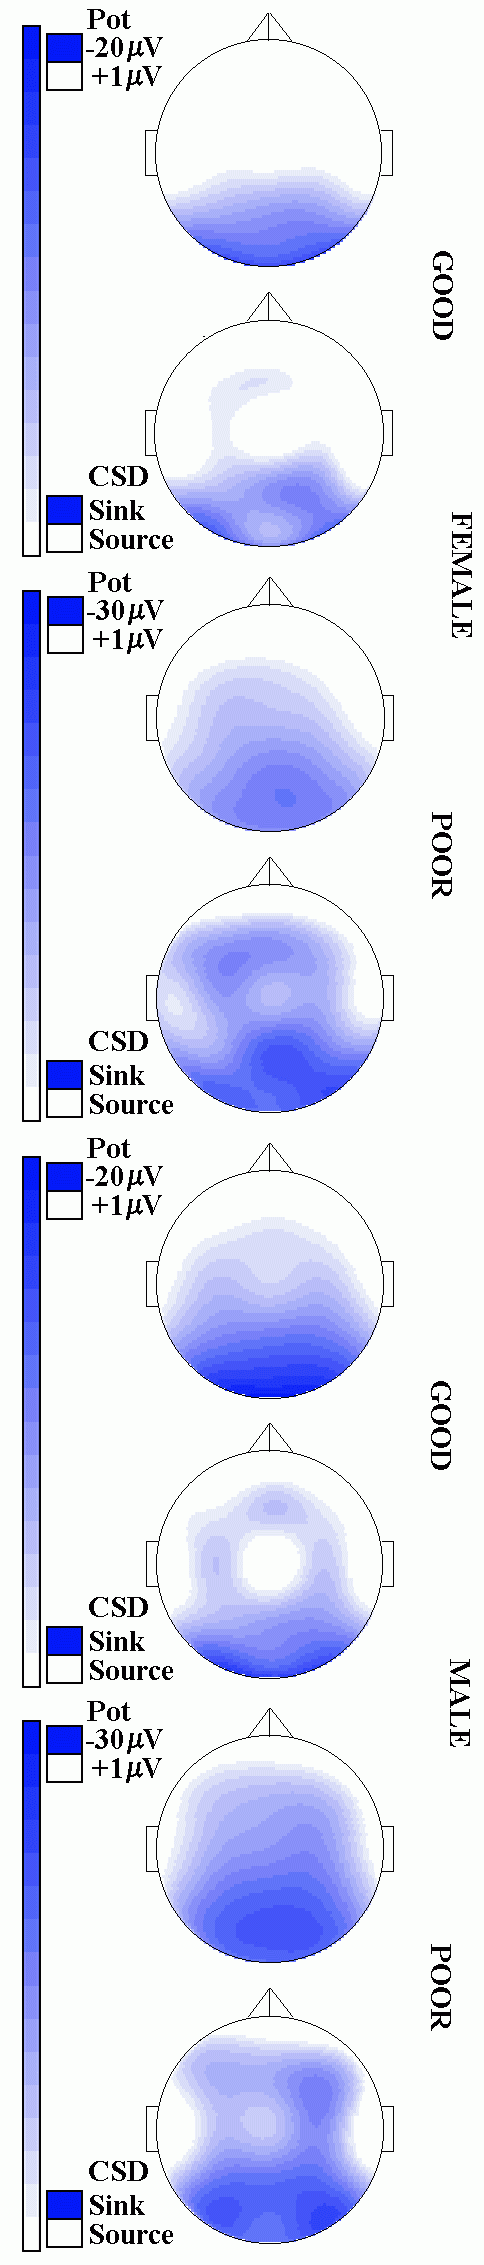
Fig. 2: Grand Mean waveforms (left) and topographical mappings (right) of SPSs during processing of 3DC items. From top to bottom: Female-good/poor, male-good/poor. Waveforms: 8 out of 24 recorded channels are displayed, stimulus onset at sec 0; Mappings: only the value centered around 4.9 sec post stimulus, and only negative shifts are displayed, top: potential mapping, below: current source density transforms. Note that the m V-range displayed is different between groups since the scale has been adjusted to maximal amplitudes (20 m V vs. 30 m V).
Table 1: Behavioral data. Mean ± STD. 3DC: 3DC score (k=17 items), WPT: word-power test score (42 items), %: percentage of correctly solved spatial items during EEG recordings
|
|
Age |
3DC |
WPT |
% |
|
Female Good |
22.5 ± 2.0 |
16.3 ± 1.0 |
33.3 ± 3.1 |
90.3 |
|
Female Poor |
23.6 ± 1.8 |
4.1 ± 2.0 |
35.7 ± 1.8 |
68.2 |
|
Male Good |
23.9 ± 2.1 |
16.1 ± 0.8 |
36.2 ± 1.6 |
93.0 |
|
Male Poor |
25.8 ± 2.8 |
6.1 ± 2.2 |
35.8 ± 1.8 |
77.0 |