The post Simple density experiments to do at home appeared first on Exploring our Oceans .
]]>
Here we propose four experiments to see how temperature and salinity are very important determining the density of water. Water becomes denser as it cools down (before approaching its freezing level). Similarly, it becomes denser when it becomes saltier. By changing the density of water we will show how we can generate circulation, just like in the real oceans.
First of all, we need the following ingredients:
- 2 small transparent containers (like two glasses or jam jars)
- 1 medium transparent container (enough to fit ~3 pints of water)
- Water (both cold and warm)
- Salt
- Food colouring (2 different colours)
- An ice cube tray (to freeze coloured water)
- A small sponge
- A spoon or an eye dropper
Experiments 1 and 2. Cold water on top of fresh and salty water.
In the first two experiments, we will study what happens when very cold water arrives in the ocean’s surface. Beforehand, we will mix some food colouring with water. Just enough to fill an ice cube tray. We should have a couple of coloured ice cubes before starting the experiments. Once we are ready, we will fill the two smaller containers (or glasses) with water, so we can run the two experiments at once. In one of them we will disolve one or two table spoons of salt. This way, one glass will contain fresh water and the other one salty water. Then, at the same time, we will add one ice cube to each of the containers. Can you see any differences? What do you think it will happen to the cold water that melts off the ice on fresh water? And what happens when it melts on water that is much saltier? Feel free to make your guess and try out the experiment before seeing the solution at the end of the post!.
Experiment 3. Salty water on top of fresher water.
For the third experiment, we will look into what happens when salt water is formed on top of fresh, warm water. This time we need the larger container. We will fill half of it with warm water. On the side, we will prepare some salty and coloured water by adding food dye and a couple of table spoons of salt to a pint of water. Then, with a lot of care and with the help of a spoon handle or eye dropper, we will slowly pour in the coloured water in, letting it flow down the side of the container rather than pouring it directly. We want to avoid splashing and mixing. In this case, what do you think it will happen when adding saltier water onto fresh, warmer water? Can you think of any place in the world where you can find cold and salty water being added on top of fresher and (slightly) warmer water? Do try this experiment first, then see a demonstration at the end of the post.
Experiment 4. A layered ocean.
Finally, we propose a forth experiment. This time we want to represent the multi-layered ocean. We will see that in the real oceans, layers of different density are established all over the planet. In fact, by just measuring some of the water properties (like temperature and salinity), we are able to trace waters that were formed much further away in different places of the world! For this experiment we will use again the medium sized container and three different types of water. First a pint of transparent water, with 2 tablespoons of salt. Then another pint of fresh and warm water, with one of the food dyes. Finally, another pint, this time with a different dye colour and 4 tablespoons of salt. In the container, we will first add the transparent salty water. Then, with the help of a sponge floating on the top, we will very carefuly add the warm and fresh water on top of the sponge. This is to help adding the water without mixing, so that a distinct interface can be seen. Finally, with the help of a spoon handle or the eye dropper, we will pour the last salty and coloured water through the side. Now, how many layers do you expect to see (one mixed “soup”, two different layers or more?). If any layers are formed, in which order do you expect them to be?
And the demonstration…
We hope you could manage to reproduce these experiments at home. Now, let’s find out the solutions. In fact, you can “see” them shown by some of us. A couple of years ago we did these experiments and recorded a video. Watch it to see how we did and the results we got. We also discuss what is happening and where in the real world you can find these phenomena. And please, feel free to make any questions or comments below.
https://www.youtube.com/watch?v=CBN9Cg9tt2s
The post Simple density experiments to do at home appeared first on Exploring our Oceans .
]]>The post Mixing in the oceans. Some extraordinary phenomena. appeared first on Exploring our Oceans .
]]>
Double diffusion generating salt fingers. The different rates of diffusion from heat (faster) than composition/salinity (slower) allow for a previously buoyancy-stable layer to become unstable.
Mixing in the oceans is important for it has a principal role transferring heat and energy, as well as balancing oceanic properties. Therefore there is an important amount of research going on. Furthermore it is responsible for some of the most beautiful phenomena that we find in the oceans. Taking advantage of some lab experiments that I got to do recently, I would like to introduce some aspects of mixing and to show some of those wonderful phenomena.
The smallest sort of mixing is molecular diffusion; the intrinsic dynamics of the fluid’s molecules results in a very slow mixing. Imagine a trickle of milk on a steady cup of tea. Without stirring, the milk would eventually mix with the rest but would take a very long time. Thus, we usually stirr our tea to create turbulent motion and blend it faster.

Tea diffusing into water
Turbulence occurs in many ways, some of it as waves, tides and eddies. But there are many other interesting ways. An example of those are the Kelvin-Helmholtz instabilities, as the ones pictured below. You may have seen them as clouds, shaped as waves; also in the bands of Saturn or the Red Spot of Jupiter. But they can also occur in the water. When two overlaying layers move at different speed, they generate a vertical shear. Depending on the conditions, that shear can become unstable and then break the interface in wave-like structures that mix the proximities of those layers. You can see it in the picture below or in the video.

Kelvin-Helmholtz instabilities generated in the lab. The red water layer is denser than the overlying transparent water. When tilting the tank by lifting the right-side, red water starts moving to the left and the upper layer to the right. As the shear increases, the instabilities occur and mix the water.
Video explaining how to generate these instabilities in the lab.
Another cool kind of instabilities are the Rayleigh-Taylor instabilities. When we suddenly have a layer of water much lighter than the layer above, buoyancy is unstable and the lighter layer will push upwards towards the denser layer, generating mixing again. This phenomenon is harder to observe in the oceans, but for instance it can also be seen in salt domes, weather inversions and even after Super Novas, such as the Crab Nebula. Isn’t it great that the same physics and phenomenon occur in such different places? You can see the beautiful structures generated by this instability in the picture below. Also another video of the experiment (note the internal waves generated in the second part of the experiment!)

Evolution of Rayleigh-Taylor instabilities as two layers of different density and buoyancy-unstable meet together. In a tank, a lighter green layer is first separated by a screen from the overlaying denser transparent water. As the screen is removed, the instabilities and mixing occur.
Video explaining the Rayleigh-Taylor instabilities. First with just two layers, then with 3 layers (the coloured one being middle range density). In the latter case, note the internal wave generated after the mixing.
So here we have seen just some examples of phenomena which generate mixing. Although there are many other ways and scales at which mixing occurs. You can see that the topic is a broad world, and at the same time a very important protagonist in the study of the oceans and the transfer of energy and properties.
The post Mixing in the oceans. Some extraordinary phenomena. appeared first on Exploring our Oceans .
]]>The post Amphidromic Points: tidal spiders in a real World appeared first on Exploring our Oceans .
]]>However, up to this point, we have considered Earth as an idealised spheric planet completely covered by water, but that is not the case. In fact, the presence of continents, coastlines and the uneven shape of Earth determine the tides as we observe them in “real life”.

The complex system of tides in the North Sea. The spider-looking features are amphidromic systems or amphidromic points. They will be explained below. Source (http://isis.uwimona.edu.jm/uds/GEOHAZARDS_2001/coastal2001/NorthSeaamphidromKING.jpg)
To understand how that works, let’s start with a big closed basin surrounded by continents, picture the North Atlantic but completely surrounded by land. In this case, water cannot freely bulge and follow the Moon’s track. Actually, water will try to swell in a similar fashion, as it undergoes the same physics. So, as Europe rotates towards the Moon’s position –where gravity pull becomes larger- the water will start accumulating towards the European continent. Then, as the rest of the basin and the American continent follow towards the region of maximum pull, water will switch sides and accumulate towards America. Hence, water will propagate from one side to the other as a sloshing wave. In a similar way as filling a box with water and rocking it from side to side; water will generate high and low tides by the sides, but the centre will remain with the same water height. We call that a node, which are the regions that act as a swelling axis. In that case, a “big box” would allow for a big slosh, whereas a small one would have a smaller swell. That is why the Mediterranean sea has very small tides.

Sloshing wave in a cubic tank. This is how the water in a basin would bulge if Earth did not rotate. Source (http://science.kennesaw.edu/~jdirnber/oceanography/LecuturesOceanogr/LecTides/1024.jpg)
That is not everything! We still haven’t thrown in the effects of rotation; the Coriolis effect. As water is sloshing from side to side, it is flowing and therefore being deflected by Coriolis. So imagine a high tide by Europe that is propagating towards America, since we are in the North Atlantic (northern hemisphere), the deflection is towards the right (northwards). In the opposite case, when flowing from America to the European continent, the deflection towards the right will be southwards. As a consquence we end up with a circular sloshing situation, similar to a gyre but flowing counterclockwise (in the northern hemisphere). Now, instead of rocking our box with water, we are swinging a bowl with water in circles, making a wave that is propagating by the sides of the bowl countercloclwise. This time, our node is just a point in the centre of the basin where there are no tides; it is conserving the water height. The further away from that point, the higher amplitude tides will have. We call those points “Amphidromic Points”, and tides propagate in a circular way around them.

The effects of rotation (Coriolis) generates a standing rotating wave, like a sloshing wave travelling around the sides of a tank with a central point with no tide at all. Source (http://ocean.tamu.edu/wormuth/tides/standingwavemotion.gif)
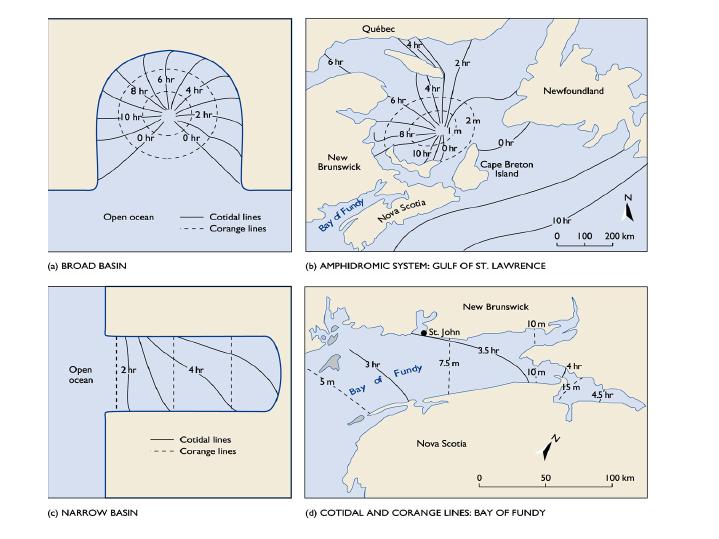
That was in a perfect closed basin, but they are all somewhat connected, and they influence on each other. The irregular shapes of continents and coastlines make different sorts of amphidromic systems (like the ones pictured below). They all have similar characteristics, though. The node at which there is no tide is called Amphidromic Point. Then, the lines that spread away from that point as if spider legs are called cotidal lines, and they picture the time lag of the tide (where the position of the wave’s crest is found in time). Finally, the dashed lines that circle around the amphidromic points are corange lines, and they represent the amplitude of the tide (how high/low it will be). The further away from the amphidromic point, the higher the tide will be.

Examples of different basins and how tides adapt to their shape. They have common features (cotidal lines for the wave’s phase, corange lines for the magnitude of the tide and amphidromic points where there are no tides). Source (http://ffden-2.phys.uaf.edu/645fall2003_web.dir/Ellie_Boyce/cotidal%20corange%20fig.jpg)
Generally, amphidromic points would be located at the centre of perfect shaped basins, but as said before, the distribution of land is quite irregular. Thus, the effects of all of them together set a system of amphidromic points all over the planet. You can see in the picture below where those amphidromic points are found, and how tides rotate around them periodically (anticlockwise in the northern hemisphere, clockwise in the southern one). Also, the colour pictures the intensity of the tides; blue for very small ones, and dark red for the largest on Earth. Another amazing feature is that both Madagascar and New Zealand act as an amphidromic point themselves, and tides rotate around them every 12.5 hours. However, they allow for strong tides by their shores.

Global distribution of amphidromic points with their cotidal lines and relative coranges. Source (http://science.kennesaw.edu/~jdirnber/oceanography/LecuturesOceanogr/LecTides/1116.jpg)
Finally, this is a global picture, but then again we can find smaller scale features in certain straits and small basins (like the complex system of tides showed in the first picture). How can sea level rise affect those systems? As you can see, tides are very complex and hard to predict, although those spider-shaped systems, by which tides structure, are an amazing manifestation of planetary power.
The post Amphidromic Points: tidal spiders in a real World appeared first on Exploring our Oceans .
]]>The post My Research: Cristian Florindo-Lopez appeared first on Exploring our Oceans .
]]>My name is Cristian Florindo-Lopez and this autumn I will be part of the “Exploring our Oceans” MOOC’s mentors team. On a regular day, I am a PhD student on my third year at the National Oceanography Centre in Southampton.
In today’s post I would like to share with you what my research is about. Briefly, I could say it is framed in the dynamics of Polar Regions, specifically the Arctic Ocean. I look at how freshwater is being stored up there and how it is eventually reaching the Atlantic Ocean.

Have you ever seen the Arctic “from above”? We are used to see Earth projected on a map centered at the Equator, but this is how the Arctic would look like as seen from atop.
The Arctic Ocean itself is undergoing rapid changes; for instance it is warming twice as fast as the rest of the globe! Another change we have seen over the last years is a huge accumulation of freshwater. The Arctic Ocean, despite engulfing only a 1% of the total area of the oceans, it is the watershed for about the 10% of the globe’s river runoff! Together with enhanced melting and more precipitation (snow or rain) than evaporation, it is the least salty ocean in the planet. For reasons we still don’t fully understand, freshwater is building up at the surface faster than it is naturally flowing to the Atlantic Ocean. It is believed that a rapid release of that water to the Atlantic Ocean could have important implications in the oceanic circulation and in the European climate; therefore it is essential to gain a better understanding of Arctic Dynamics.
However, Arctic monitoring is very challenging. It is a remote and harsh environment; taking measurements in the region is very hard and expensive. Thus, we do not have time series that are long enough to fully understand how the Arctic varies. Fortunately, since the polar basin connects to the Atlantic Ocean, those changes can be tracked further south. So, the goal of my PhD is to study observations at the Labrador Sea, near Canada, to see how they relate to the Arctic variability. Then, we could use those measurements taken over many decades to evaluate how the Arctic Ocean has changed over that time and gain a better understanding of the magnitude of present changes.

Arctic Melt Ponds, formed when sea ice starts melting in the summer. Freshwater is collected in depressions which enhance melting until they break through and reach the ocean below. Image by NASA Goddard Space Flight Center.
As a polar researcher, I am fascinated by the physics of those regions, from the Arctic sea-ice to the Antarctic continent. They are two similar environments but altogether completely different. I am also concerned about climate change and its consequences. Finally I am greatly interested in all sorts of adventures, fieldwork and the development of new oceanographic instrumentation and new technologies. Feel free to ask and chat about any of those topics!
I hope you have a great time exploring the wonders of our oceans throughout the next weeks. I am very excited to be part of the MOOC team and look forward to start soon with the course and discussions.
The post My Research: Cristian Florindo-Lopez appeared first on Exploring our Oceans .
]]>