The post ROV dives for dummies! appeared first on Exploring our Oceans .
]]>Everything you always wanted to know – from A to Z about how to succeed a ROV (remotely operated vehicle) dive.
1) Go to sea with a bunch of very talented ROV pilots: 6 is a minimum number (3 for each 12 hours shift).
2) Set up the OFOP (ocean floor observation program) software on the computer to be able to record in real time any special features, biological or geological (such as fish, scarp, boulder field, shimmering water, soft sediment, anemone garden, etc.).
 |
| A biologist, a geologist and a map wizard discuss locations (Katleen, Bramley and Oisin). © Adeline Dutrieux. |
3) Plan the dive according to your purpose and allowed time. Set up the planned track on the ROV monitors to help scientists and ROV pilots to follow it. Technically a dive could last forever. But ideally, a dive will last about 12 to 24h or until it had achieved its objectives.
4) Start the dive. Watch the blue becoming darker and darker.
 |
| Start of a ROV dive. © Evi Nomikou. |
5) Two scientists join three ROV pilots in the ROV container, located on the back deck, close to the immersion platform of the ROV. Together they will watch the HD camera located on the front of the ROV and discuss the appropriate moves to make.
 |
||
Isobel and Patrick (in the back) are in the ROV container, their eyes focused on the HD camera in front of them, the OFOP map and the planned track. © Maria Judge.
|

6) One scientist is in charge of the camera joystick and capturing as many photographs as she/he can with a stills camera mounted on the ROV frame. Remember to zoom in close to the seafloor to allow animal species counting!

7) The other scientist is in charge of recording and clicking as much as she/he can on the OFOP (ocean floor observation program) software along the track.

8) Together identify locations for sampling and ask to stop the ROV for rock or biology sampling. Sometimes we cleaned the seabed of glass bottles.
 |
| Grabbing a green glass bottle, next to a squat lobster. Fortunately, we didn’t meet many of them. © ROV Holland 1. |
9) See a crinoid, or a skate egg. Ask for “grabbing” or “sluuuuurping” the specimen (main biology goals during our mission). From the biology side, to get an idea of environmental conditions, we can look at the bathymetry (the shape of the seabed) and examine whether there are relationships between where species occur and different terrain characteristics (e.g. depth, slope, direction of slope, roughness of the terrain).
10) On the geology side, look at the faults, scarps, fractures, change of sediment lithology, or boulders fields. Ask one of the ROV pilots to kindly sample some rocks at specified locations. He/She gently manipulates the arm and grabs with dexterity the rock. Sometimes that rock is bigger than expected – we call it “iceberg”!
11) Decide which bucket or drawer compartment to drop the sample in. Very often, each compartment ends up with 2 to 5 samples. Remember to write down the sample location, the event number (sequence in which it’s collected), with their precise location and description so that we can identify them when they are brought on deck.
12) Once in a while, when the terrain allows it, create a photo-mosaic. It consists of going from side to side on a steep scarp, and then moving up a level and repeating the process to obtain a full and very detailed surface of the scarp (like a close-up panorama).
13) Every two hours, another buddy pair comes to take the lead. Fresh minds start over.
14) A dive can continue as long as the weather stays fine. At the end of it, retrieve the ROV on deck.
 |
| A stalk yellow crinoid. © ROV Holland 1. |
 |
| The arm gently detaches (at the top) the stalk yellow crinoid from the seafloor. © ROV Holland 1. |
15) On deck, once the ROV is secured by the technicians, start unloading the samples. It can be a puzzle with sometimes vague description (“black large rock”) and blurred pictures to identify which rock belongs to which event so be careful to provide better descriptions in the next dive. Similarly, collect the biological samples. Label everything!
 |
| Maria and Arne are unloading the biology and rock samples from the ROV on a night shift. © Maria Judge. |
16) Once all rocks have been identified to each event/sampling location, brush them from their saline and encrusted life cover.
 |
|||||||
| Brushing rocks – they stink! © Evi Nomikou.
17) Photograph the rocks with a correct label and measure the dimensions.
Oisin, Aggie and Katleen are taking care of the push cores. 18) Chop a bit of rock and describe their textural and mineralogical features. 19) Give a provisional name. 20) Finally pack them in their bag. Make sure the label is legible and will stay. They will be described later in full details in labs by petrologists. Concerning the biology, scientists will look at the morphology in greater detail, and if possible, carry out molecular analysis (e.g. DNA, RNA). Many deep-sea species are still unknown, so maybe one of the sample we collected will turn out to be a new species! 21) Job done! Have a cuppa.
|


The post ROV dives for dummies! appeared first on Exploring our Oceans .
]]>The post Our deep-ocean expedition in numbers appeared first on Exploring our Oceans .
]]>
Our last day of science sampling and we are collecting water just above a site where we suspect there is low-temperature fluid flow at the seafloor 2.5km below the ship. This is the site that in 1974 was named TAG after dredging hydrothermal deposits from the eastern rift-valley wall. I worked on these precious samples much later in the 1990’s and demonstrated that hydrothermal neodymium could be traced in these ferromanganese crusts demonstrating that they formed from low-temperature vent fluids rather than from seawater. We want to see what we can see in the deep water over this site and measure the input from the seafloor.

Over the last 38 days we have put our sampling rosette into the deep water 83 times and collected nearly 30,000 litres of seawater for processing, filtering, measuring and archiving. We have pumped over 45,000 litres of seawater through our deep sea cartridges to strip out natural radioactive isotopes that we use measure time in the deep sea. We have filled the container on the aft deck with over 100 crates of samples carefully wrapped for transport around the world to our labs in the UK, the US and elsewhere. Our physics team have made over 20 million measurements of turbulence through the water column and measured the plumes wafting through the deep waters in intricate detail.

We have steamed 4200 nautical miles since we left Southampton and have over 1000 to go to get to Guadaloupe. We have drunk over 7000 cups of coffee and eaten nearly a tonne of potatoes and over a 1000 rashers of bacon. We’ve hit the gym (perhaps because of the potatoes) and collectively rowed, run and cycled thousands of kilometres. We’ve played 350 games of cribbage, nearly 500 games of table football and some challenging games of darts when the ship is rolling.

All 52 people on the ship have worked (and played) really well together on this expedition – we have made new friends and close collaborations that will last a long time. On this long passage south to Guadaloupe we are drafting the ideas for the next proposals, practicing the talks for the big conferences coming up in 2018 and of course getting our fancy-dress costumes designed and made for the ‘RPC’.

The post Our deep-ocean expedition in numbers appeared first on Exploring our Oceans .
]]>The post Mapping the deep, and the real story behind the “95% unexplored” oceans appeared first on Exploring our Oceans .
]]>One topic we’ll look at in Week 1 of the course, “A hidden landscape”, is how we map the ocean floor, and how much has been mapped at different levels of detail. So the publication of a new ocean floor map this week, created from satellite data by David Sandwell of Scripps Institution of Oceanography in San Diego and colleagues, is very timely.
We’re often told that we know more about the surface of Mars / the Moon / Venus (delete at whim) than the depths of the ocean, and that 95 percent of the ocean is “unexplored”. That makes for a great meme, and there’s a nice infographic out there on social media to illustrate it:
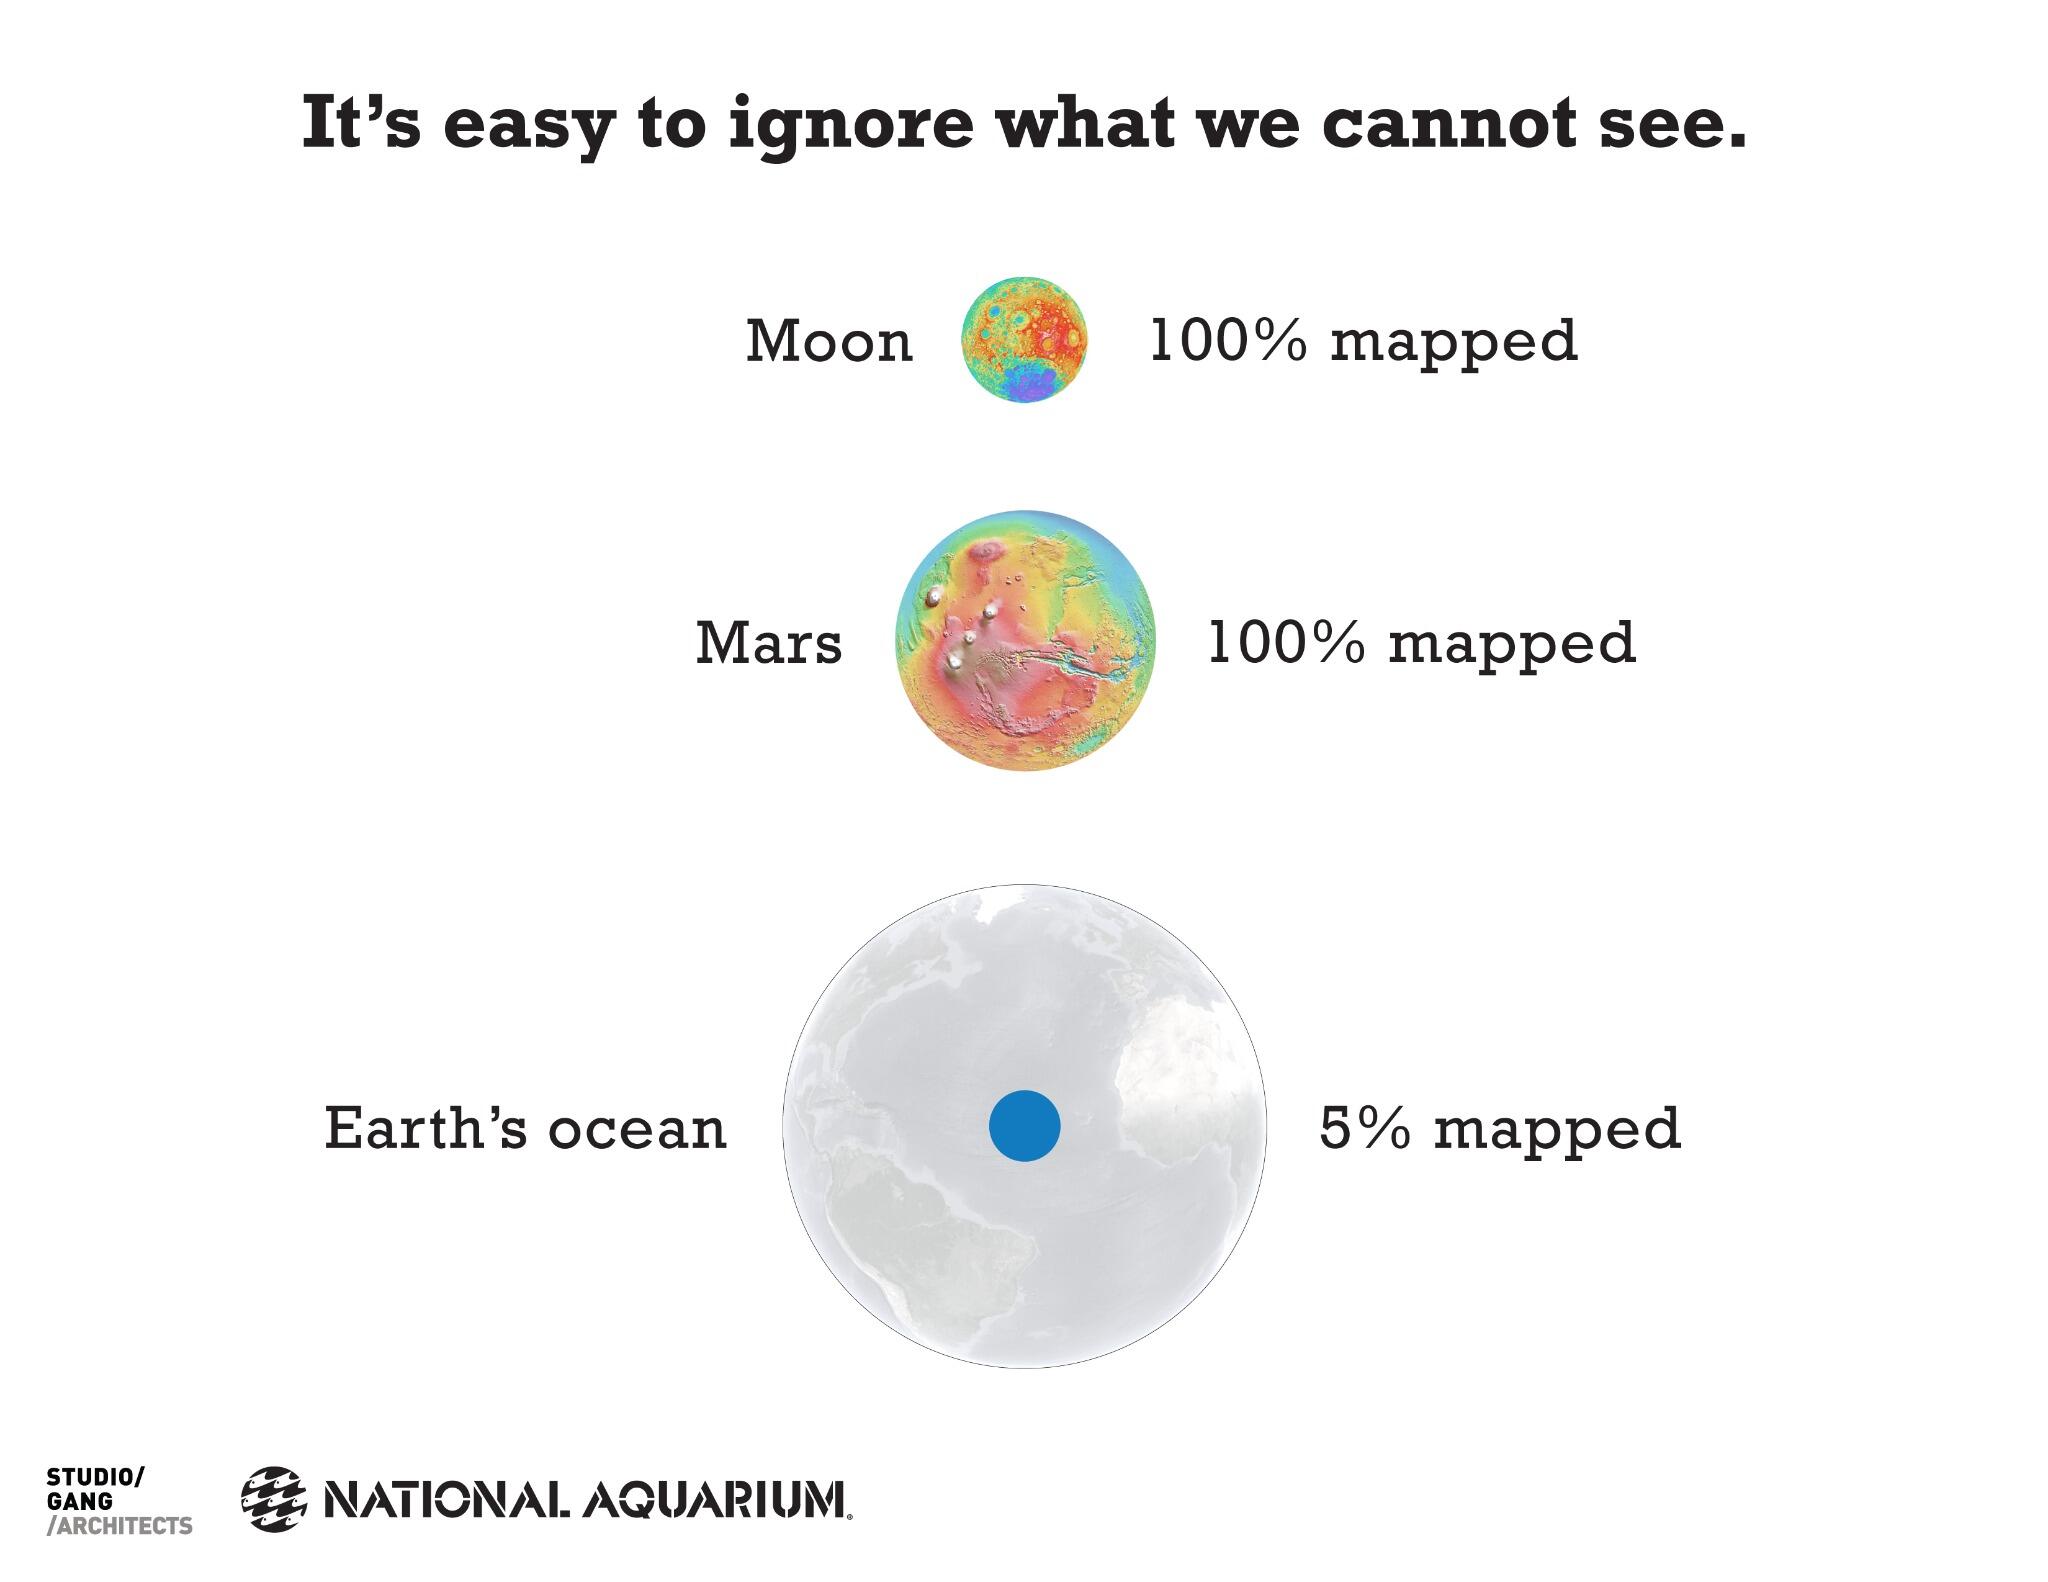
But it’s not quite the full story: in some ways, we have come much further than “five percent mapped”, but in other ways we still have far to go. It all comes down to what we mean by “explored”, and how we map the ocean floor. So let’s examine some of the facts behind the “95 percent unexplored” meme and those comparisons with our celestial neighbours.
The entire ocean floor has now been mapped at up to ~5 km resolution, which means we can see most features larger than ~5 km across in those maps. That’s the resolution of the new global seafloor map, which uses some nifty tricks with satellites to estimate the landscape of the seafloor, and even reveals some features of the Earth’s crust lurking beneath seafloor sediments. And the previous global map of the ocean floor, created using the same techniques and published in 1997, had a resolution of ~20 km.
Unlike mapping the land, we can’t measure the landscape of the seafloor directly from satellites using radar, because seawater blocks those wavelengths of electromagnetic radiation. But satellites can use radar to measure the height of the sea surface very accurately. And if there are enough measurements to subtract the effects of waves and tides, satellites can actually measure bumps and dips in the sea surface that result from the underlying landscape of the ocean floor.
Where there is a large underwater mountain or ridge, for example, the tiny local increase in gravity resulting from its mass pulls seawater into a slight bump above it. If instead there is an ocean trench, the weaker local gravity produces a comparative dip in the ocean surface.
It’s an astounding feat of precision measurement, involving lasers to track the trajectory of the measuring satellite, calibrations with local gravity measurements made by ships, and inevitably quite a bit of maths in processing the data. The new map uses data from the Cryosat-2 and Jason-1 satellites, and reveals features not seen in earlier maps using data from older satellites. You can explore the latest map for yourself here, including downloads to show it in Google Earth.
So we do actually have a map of 100 percent of the ocean floor at up to ~5 km resolution; in that sense, it is certainly not just “five percent mapped”. But that global map of the ocean floor is admittedly less detailed than maps of Mars, the Moon, or Venus, because of our planet’s watery veil.
NASA’s Magellan spacecraft mapped 98 percent of the surface of Venus at ~100 m resolution. The entire Martian surface has also been mapped at ~100 m resolution, and just over 60 percent of that planet has now been mapped at ~20 m resolution. Meanwhile, selenographers have mapped all of the lunar surface at ~100 m resolution, and now even at ~7 m resolution.
To map the ocean floor back home in greater detail, we have to use sonar instead of satellites. Multibeam sonar systems aboard ships can map the ocean floor at ~100 m resolution, but only in a track below the ship. Those more detailed maps now cover about 10 to 15 percent of the oceans, which is an area roughly equivalent to Africa in size. And along with older, single-beam echosounder data from ships crossing the ocean (which were the source of data for the earlier famous “World Ocean Floor Map” by Marie Tharp and Bruce Heezen), we have “soundings” for a total of perhaps around 20 percent of the ocean floor.
You can explore some of the recent shipboard multibeam map coverage for yourself at GeoMapApp: if you zoom all the way in on the map, you can the tracks of ships that have mapped areas at higher resolution than the satellite base map (but please don’t misinterpret the sometimes grid-like patterns of ship’s survey lines as the streets of Atlantis).
Mapping at the level of detail achievable by shipboard sonar systems still reveals plenty of surprises. The first phase of searching for Malaysian Airlines flight MH370 in the Indian Ocean, which has involved mapping from ships to plan future surveys by underwater vehicles, has revealed new seamounts and other features that were not visible on satellite-derived maps of the area.
And on a personal note, in 2009 I was aboard an expedition near the South Sandwich Islands in the Southern Ocean when our ship’s sonar revealed a seafloor crater, 4 km across and 1.6 km deep, that wasn’t on any satellite maps. We later found some very unusual deep-sea vents and a “whale fall” at the bottom of that crater too, but that’s a story for another time.
However, if we want to detect things just a few metres in size on the ocean floor, such as the mineral spires of deep-sea vents or the wreckage of missing aircraft, we need to take our sonar systems much closer to the seabed using underwater vehicles or towed instruments. At present, less than ~0.05 percent of the ocean floor has been mapped to that highest level of detail by sonar, which is an area roughly equivalent in size to Tasmania. And of course, actually to see the seafloor using cameras or our own eyes means getting even closer, using tools such as remotely operated vehicles or manned submersibles.
So the “95 percent unexplored” meme doesn’t really tell the full story of our exploration of the oceans. When it comes to having a large scale map, the ocean floor is perhaps not as unexplored as we might think, with 100 percent coverage at ~5 km resolution and around 10 to 15 percent coverage at ~100 m resolution. That 10 to 15 percent is similar in resolution to the current global maps of Mars and Venus.
But our exploration of the oceans depends on what we want to know about them. If our questions are “what does it look like down there?” or “what’s going on down there?”, then the area that has been “explored” is arguably even less than the ~0.05 percent mapped so far at highest resolution by sonar.
Philosophically, when it comes to exploring anywhere on our dynamic world, how and when do we decide that somewhere has “been explored”? Do we declare “mission accomplished” once we’ve seen a location for the first time? The local woods where I walk my dog look very different in winter compared with summer, with different species flourishing at different times. Should I have considered them “explored” after my first visit in just one season? Exploring our world starts with mapping, but perhaps doesn’t really have an end.
Jon Copley, October 2014
The post Mapping the deep, and the real story behind the “95% unexplored” oceans appeared first on Exploring our Oceans .
]]>The post Onwards and downwards: when ROVs or AUVs are lost in ocean exploration appeared first on Exploring our Oceans .
]]>Always in a Chief Scientist’s mind at sea is the question “what will we do if…”. Those “what ifs” include the weather, medical situations, and problems with any piece of equipment, from the ship’s own hardware to the various tools that we put into the ocean. I’ve never been on an expedition where we were able to stick to “Plan A”, and it sometimes seems like we have more contingency plans than there are letters in the alphabet.
The loss of a remotely operated vehicle (ROV) or autonomous underwater vehicle (AUV) is utterly crushing for those aboard a research expedition and their colleagues ashore. But whenever we send something into the ocean depths, there is never an absolute guarantee that it will come back. There is always a risk involved, although we minimise risk through preparation and manage it in our expedition plans.
The only way to avoid risk completely is not to go at all; some risk will always be there, and that means that sometimes the dice will not roll in our favour. That does not mean we are reckless: an assessment of risk-versus-return is typically part of the funding decision for projects, and our back-up plans are usually carefully scrutinised.
To obtain some kinds of knowledge – particularly when physical samples are required for analysis – there is no alternative to sending equipment into the deep ocean, because the ocean’s watery veil masks its depths from many forms of “remote sensing”. And although we have learned a lot from a century or so of largely “blind sampling” by equipment such as trawls and seabed corers (which are still fine for answering some questions in some areas), we now often require more detailed sampling and surveying, using deep-sea vehicles, to answer further questions.
Here is a quick history of some of the remotely operated vehicles (ROVs) and autonomous underwater vehicles (AUVs) that have been lost in the service of deep-sea exploration – but also what they had achieved, and how the research in which they were involved has continued. Expeditions have continued in the immediate aftermath of such incidents, using other equipment aboard, and in the longer term, replacement and rebuilt vehicles have achieved scientific successes.
We press on, for reasons including the potential benefits that the ocean holds for our future, from new materials to medicines, and to understand our impact on the future of the ocean. So the motto is “ever onwards and downwards”.
HROV Nereus (10 May 2014; Kermadec Trench)
Nereus was a new kind of “hybrid” vehicle, combining ROV and AUV technology into an efficient and cost-effective tool for reaching “hadal” depths, i.e. into the deep trenches, where most other vehicles cannot go. Nereus had already reached the ocean’s deepest point in the Marianas Trench, and more recently dived on the world’s deepest known undersea vents in the Cayman Trough.
The current HADES expedition has provided stunning insights into the Kermadec Trench, and will be able to continue using other tools aboard, such as benthic landers.
Autonomous Benthic Explorer (aka ABE; 5th March 2010; Chile Triple Junction)
ABE was one of the first AUVs to be used routinely for science, coming into service in the mid-1990s and completing 221 missions, including pinpointing hydrothermal vents south of the equator in the Atlantic, and obtaining the first seafloor images of a hydrothermal vent field on the SW Indian Ridge (which my colleagues and I then dived on with an ROV in 2011). The experience gained from developing and operating ABE has also fed into the next generation of AUVs for further ocean exploration.
Isis ROV (19 January 2011; Bransfield Strait, Antarctica)
A day I won’t forget, as one of the team aboard the ship. One year previously, we had used the Isis ROV to study the southernmost known “black smoker” vents in astounding detail. Isis had also surveyed deep-sea canyons off the coast of Portugal, and discovered king crabs creeping up from deep waters towards the Antarctic continental shelf.
The loss of Isis was a major blow, but that expedition continued, using other tools such as a towed camera sled and corers, discovering yet more hydrothermal vents in a seafloor crater near the South Sandwich Islands, investigating volcanic ridges near the Antarctic Peninsula, and revealing how worms boost the flux of iron from deep-sea sediments into Antarctic waters. Those results were a testimony to the leadership of the expedition’s Chief Scientist, Prof Paul Tyler, and the adaptability of the technician team aboard.
(timelapse of ROV Isis rebuild by Jackie Pearson, National Oceanography Centre)
The decision to repair the Isis ROV facility following that expedition was not taken lightly, but the underwater vehicle is not the entire facility, which also includes the shipboard control centre, ROV winch system, and not least the people who operate the facility; so overall, the cost of restoring the vehicle was a fraction of the existing investment in the facility. In the interim, UK expeditions requiring an ROV used Germany’s Kiel6000 ROV through international arrangements for sharing such equipment. A fully restored Isis ROV facility then returned to the Antarctic deep-sea vents in December 2012, and since then has dived on the world’s deepest known undersea vents in the Cayman Trough, and investigated deep-sea corals across the Atlantic.
Autosub-2 AUV (16 February 2005; beneath Fimbul Ice Shelf, Antarctica)
The vast cavities beneath the permanent floating ice shelves that form a fringe around Antarctica and Greenland are some of the few places that only autonomous underwater vehicles can reach. The ice shelves themselves are hundreds of metres thick, and can be hundreds of kilometres long, with water several thousand metres deep beneath them. What goes on in those cavities could be important for understanding the formation of deep waters that sink from polar regions to drive ocean circulation, and they could also be home to unusual colonies of marine life.
Drilling holes through ice shelves and lowering sensors into the hidden ocean below can provide some data, but only in single locations, and at considerable cost in establishing a remote field station on the ice shelf, with all the equipment and fuel required to melt holes down through it. Meanwhile, ROVs can’t reach far into the cavities from the open ocean because of their tethers, so AUVs are potentially the best tools to survey these environments. The Autosub Under Ice programme was therefore designed to explore the marine environment beneath permanent floating ice shelves using the Autosub-2 AUV.
Analysis of previous AUV missions indicated that the risk of losing Autosub-2 during a >100 km mission beneath an ice shelf could be >50%. Consequently, potential insurers of marine equipment quoted an insurance premium equivalent to 95% of the vehicle’s cost, per year! So instead, the programme set aside funds to build a replacement vehicle, and began construction of it, fully expecting that one would be lost.
And indeed it was. Autosub-2 completed its first mission beneath the Fimbul Ice Shelf in the Antarctic, obtaining the first synoptic data from an ice-shelf cavity, but was lost on its second mission (consistent with a ~50% expected risk of loss). However, its replacement was already under construction, and Autosub-3 later completed missions beneath the ice shelf of Pine Island Glacier to understand changes previously observed there from satellite data, and is being used in further ice-shelf studies.
Kaiko ROV (29 May 2003; near Shikoku island)
In 1995, Kaiko – which means “ocean trench” – became the first vehicle to return to the deepest point of the oceans since the record-breaking dive of the Trieste in 1960. Kaiko dived there again in 1996 and 1998, completing more than 20 dives in total to “Challenger Deep” and collecting specimens of amphipod crustaceans, microbes, and sediments. The ROV was also used in the discovery of hydrothermal vents on the Central Indian Ridge in 2000. But in 2003, Kaiko was lost on its 296th dive as Typhoon Chan-Hom closed in towards the research ship RV Kairei.
The “launcher” component of Kaiko, which was recovered, was subsequently combined with the UROV7k vehicle to create Kaiko7000II, with a 7 km depth capability. Meanwhile, the Japan Agency for Marine-Earth Science and Technology (JAMSTEC) has also developed the ABISMO ROV as replacement for Kaiko to reach the deepest point of the oceans – and ABISMO has so far operated successfully to a depth of 9707 metres in the Izu-Ogasawara Trench.
– Jon Copley, 11 May 2014
The post Onwards and downwards: when ROVs or AUVs are lost in ocean exploration appeared first on Exploring our Oceans .
]]>The post The Trieste, 1960. appeared first on Exploring our Oceans .
]]>The Trieste was a small submersible, which carried two men to the bottom of the ocean at the Challenger Deep in January of 1960, they reached 10,911 metres below the surface! Here is a great video with some interviews with Don Walsh and footage from the expedition:
You can also read the original article written in National Geographic in August, 1960, by Jacques Piccard himself:
“Like a free balloon on a windless day, indifferent to the almost 200,000 tons of water pressing on the cabin from all sides, balanced to within an ounce or so on its wire guide rope, slowly, surely, in the name of science and humanity, the Trieste took possession of the abyss, the last extreme on our earth that remained to be conquered.”
A wonderful account of the dive, have you found any other great resources you would like to share? Let us know in the comments!
Millie
The post The Trieste, 1960. appeared first on Exploring our Oceans .
]]>