The post Our deep-ocean expedition in numbers appeared first on Exploring our Oceans .
]]>
Our last day of science sampling and we are collecting water just above a site where we suspect there is low-temperature fluid flow at the seafloor 2.5km below the ship. This is the site that in 1974 was named TAG after dredging hydrothermal deposits from the eastern rift-valley wall. I worked on these precious samples much later in the 1990’s and demonstrated that hydrothermal neodymium could be traced in these ferromanganese crusts demonstrating that they formed from low-temperature vent fluids rather than from seawater. We want to see what we can see in the deep water over this site and measure the input from the seafloor.

Over the last 38 days we have put our sampling rosette into the deep water 83 times and collected nearly 30,000 litres of seawater for processing, filtering, measuring and archiving. We have pumped over 45,000 litres of seawater through our deep sea cartridges to strip out natural radioactive isotopes that we use measure time in the deep sea. We have filled the container on the aft deck with over 100 crates of samples carefully wrapped for transport around the world to our labs in the UK, the US and elsewhere. Our physics team have made over 20 million measurements of turbulence through the water column and measured the plumes wafting through the deep waters in intricate detail.

We have steamed 4200 nautical miles since we left Southampton and have over 1000 to go to get to Guadaloupe. We have drunk over 7000 cups of coffee and eaten nearly a tonne of potatoes and over a 1000 rashers of bacon. We’ve hit the gym (perhaps because of the potatoes) and collectively rowed, run and cycled thousands of kilometres. We’ve played 350 games of cribbage, nearly 500 games of table football and some challenging games of darts when the ship is rolling.

All 52 people on the ship have worked (and played) really well together on this expedition – we have made new friends and close collaborations that will last a long time. On this long passage south to Guadaloupe we are drafting the ideas for the next proposals, practicing the talks for the big conferences coming up in 2018 and of course getting our fancy-dress costumes designed and made for the ‘RPC’.

The post Our deep-ocean expedition in numbers appeared first on Exploring our Oceans .
]]>The post Exploring environmental changes in the Antarctic with Blue Planet II appeared first on Exploring our Oceans .
]]>But the expedition also provided an opportunity to collect data about the environment – in particular, the temperature and salinity of water at different depths. Whenever we explore the oceans, I think it’s important to collect all the data we can, especially when we’re visiting remote places such as the poles and the deep ocean.

The environmental changes taking place in the Antarctic are complex – an intricate interplay between ocean, atmosphere, land ice and sea ice – with different Antarctic regions changing in different ways (e.g. Steig et al., 2009). It’s not a simple story of “more carbon dioxide traps more heat in the atmosphere that then melts the ice” (the changes in the Arctic are perhaps more straightforward in that regard, as this summary by David Shukman, BBC News Science Editor, explains).
That’s why thousands of scientists have been investigating different aspects of what’s happening in Antarctic over decades, to untangle the complex knot of processes involved. And as well as interacting with each other, the strands of that knot (ocean, atmosphere, land ice, sea ice) are also affected by natural variability (e.g. Mulvaney et al., 2012), can sometimes be influenced by changes elsewhere on our planet such as the equatorial Pacific (e.g. Ding et al., 2011), and by changes that we have made to the atmosphere – not just adding carbon dioxide to it overall (e.g. Marshall et al., 2004; Goosse et al., 2008), but also through the depletion of the ozone layer above Antarctica affecting winds around the continent (e.g. Thompson & Solomon, 2002).
The complexity of what’s happening in the Antarctic is all the more reason to take every opportunity to collect more data points, like these during our expedition:

On their own, our measurements of ocean temperature and salinity at different depths during the Blue Planet II expedition don’t tell us much – of course you can’t really understand processes or measure changes from one set of measurements in one place at one time. But the expedition’s data are archived so that scientists can compare them with other measurements, taken at other times and in other locations and combined into large datasets by international research programmes, to help towards building a more detailed picture of what’s going on.
For Blue Planet II, we were working at the northern tip of the “Antarctic Peninsula”, the narrow finger of land that points up towards South America. What’s clear from previous studies is that this particular part of Antarctica has seen some rapid recent changes, such as:
- an overall increase of around 1.8 degrees C in annual average air temperatures since the late 1940s, recorded at Argentina’s Esperanza Base (data available here), which was the closest weather station to where we were working:

- …and that’s consistent with the general pattern of warmer annual average air temperatures recorded by other weather stations towards the tip of the Antarctic Peninsula over that period (Vaughan et al., 2003). In the last few years some parts of the Peninsula have seen cooler summers again (Turner et al., 2016), possibly as a result of the regeneration of the ozone layer above Antarctica affecting the winds around it, but that doesn’t reverse the large surface air temperature increase in this region of Antarctica since the mid-twentieth century;
- Esperanza Base also holds the record for the warmest surface air temperature ever recorded in mainland Antarctica and its surrounding islands: 17.5 degrees C on 24 March 2015. That one-off warm day was probably caused by a “Foehn Wind” (which we’ll explore later);
- an increase of more than 1 degree C in summer sea surface temperatures around the tip of the Antarctic Peninsula since the 1960s (Meredith & King, 2005);
- the retreat of 88% of the glaciers on the Antarctic Peninsula since the 1940s (Cook et al., 2005; Cook et al., 2016), and the total collapse of floating ice shelves such as Larsen A in 1995 and Larsen B in 2002 (Cook & Vaughan, 2010).
Some of the changes on the Antarctic Peninsula may lie within the range of natural variations recorded in ice cores over the past 2000 years, but the recent warming is unusually rapid (Mulvaney et al., 2012). And the last time that any changes like these occurred, floating ice shelves such as Larsen B did not collapse (Domack et al., 2005), and there weren’t 7.6 billion of us who could be affected by what is going on. That’s what takes us into uncharted territory today.
Glaciers, floating ice shelves, and sea level rise
Sea level rise is one change that can affect us all, and it involves changes in the rate at which ice forms on land and flows into the ocean. Snow that falls on Antarctica eventually compresses under its own weight to form ice, building up ice sheets on the land. As more ice builds up, it flows out in glaciers and ice streams towards the coast, where it then floats out over the sea, forming the floating “tongues” of glaciers and more massive floating ice shelves. Eventually, the ice breaks off those floating tongues and shelves to form icebergs of fresh water, sometimes hundreds of metres thick.
The “calving” of icebergs from the ends of glaciers is a natural process, as the amount of snow falling on land gradually builds up more ice over time. During the Blue Planet II expedition, I was particularly interested in how that process delivers “dropstones” to the ocean floor – rocks scoured from the land by the glaciers and carried out to sea on the underside of icebergs, from which they fall to provide “islands” of rocky habitat for different types of animals on the seafloor. Glaciologists can monitor numbers of icebergs and the flow of glaciers using satellites, but I also had an opportunity to make some closer observations of bergs from the air, to try to understand more about how they deliver dropstones that we saw on the ocean floor during dives.

But when it comes to sea level rise, what’s important is the rate at which ice flows from the land into the sea via this process. The floating ice shelves and floating ends of glaciers act as buttresses for the ice, slowing its slide into the ocean. The buoyant force exerted by the ocean on the end of the floating “tongue” of a glacier, or across the front of a floating ice shelf, pushes back against the downhill flow of ice from the land. If the floating glacier tongue or ice shelf becomes thinner, or retreats so that the “grounding line” where it starts to float out from the land is further inshore, then it offers less resistance to the flow of ice from land into the ocean (there’s a really good diagram explaining the forces involved here).
So if the floating “tongues” of glaciers or more massive floating ice shelves become thinner or disintegrate, then ice flows more rapidly from land into the sea. Because ice on land is not yet afloat, when it reaches the sea it pushes up the water level, like dropping ice cubes into a drink. In contrast, “sea ice” – the skin of ice only a few metres thick created when the surface of the ocean freezes – does not have the same effect on sea level, because it’s formed from water that is already in the ocean. What matters then, for Antarctica’s role in sea level rise, is how the floating tongues of glaciers, floating ice shelves, and flow of ice from land to sea are changing.
Antarctica in three parts
Antarctica is huge: its land area (~14 million km²) is about 50 percent larger than the United States. To understand what’s going on for sea level rise, we need to divide Antarctic into three parts, because what’s happening is different in these regions:
- the Antarctic Peninsula, which is the narrow finger of land that points up towards South America (and we were working at the tip of the Peninsula for the Blue Planet II expedition);
- the area covered by West Antarctic Ice Sheet, and in particular the coastline on the Amundsen Sea where several glaciers drain that ice sheet into the ocean;
- the area covered by the much more massive East Antarctic Ice Sheet, which covers most of the interior of the continent and the South Pole.

Fortunately, there isn’t that much ice on land on the Antarctic Peninsula, where air and sea temperatures are changing the most, to drive much sea level rise from there. Further south, the West Antarctic Ice Sheet has the potential to drive much more, and some of its floating ice shelves are thinning and retreating, because of an upwelling of warm deep water. Meanwhile the enormous East Antarctic Ice Sheet fortunately appears stable, though one particular glacier outlet could be changing in ways similar to some of the glaciers draining the West Antarctic Ice Sheet.
Changes to glaciers draining into the sea on the Antarctic Peninsula
596 out of 674 (i.e. 88% of) sea-ending glaciers on the Antarctic Peninsula have retreated since records began in the 1940s (Cook et al., 2016), and 7 out of 12 of its floating ice shelves have retreated significantly or collapsed completely (Cook & Vaughan, 2010). The retreat of glaciers and floating ice shelves on the Antarctic Peninsula is driven by two different processes, one operating on each side of the Peninsula. On the western side, the floating ends of glaciers are mainly being eroded from underneath by an upwelling of warmer deep ocean water, rather than changes in air temperature. But on the eastern side of the Peninsula, more frequent warm winds create melt ponds that eat through floating ice shelves from above.
Most of the retreating glaciers of the Antarctic Peninsula are on its western side, along the coast of the Bellingshausen Sea, where there has been upwelling of warmer “Circumpolar Deep Water” to depths of 100-300 m (Cook et al., 2016). That upwelling of warmer deep water to melt those glacier tongues is a different process to the warming of sea surface temperatures further north on the Peninsula – and not a result of the warming air temperatures on the Peninsula either – but instead driven by changes in wind patterns around Antarctica that in turn drive some changes in ocean circulation (e.g. Peck et al., 2015).

Meanwhile, and in contrast, on the eastern side of the Antarctic Peninsula, the demise of the Larsen A floating ice shelf in 1995, and the Larsen B floating ice shelf in 2002, was probably hastened by warm Foehn winds, which cause melt ponds to form on the surface of floating ice shelves, eventually eating through them and breaking them up.
Foehn winds are warm winds created when a wind drops down the side of a mountain, compressing the air and thereby warming it. On the Antarctic Peninsula, circumpolar winds get pushed up against the western side of the mountains of the peninsula, and when they spill over the top or through gaps to the eastern side, they drop down and create the Foehn warming effect there, contributing to the break-up of floating ice shelves (Cape et al., 2015). There’s a useful BBC News feature about the phenomenon – and its effect on ice shelves on the eastern side of the Antarctic Peninsula – here.
(As an aside, the factors behind the huge iceberg that recently broke off the Larsen C ice shelf, and whether the remainder of that floating ice shelf will similarly collapse soon, are even more complex, as discussed here).
Immediately after Larsen B ice shelf collapsed in 2002, scientists measured an acceleration in the slide of ice from the land there into the sea, contributing to sea level rise (Rignot et al., 2004). Fortunately, the Antarctic Peninsula is only a narrow strip of land and there’s not so much ice on land there: if all the ice on the Antarctic Peninsula slid into the sea, it would raise global sea level by about 24 centimetres (Pritchard & Vaughan, 2007), and what really matters is how quickly that process happens. To put that in context, the current rate of global sea level rise is about 3 millimetres per year, and ice loss from the Antarctic Peninsula is currently contributing around 0.16 mm per year to global sea level rise (Pritchard & Vaughan, 2007).
Changes to glaciers draining ice into the sea from the West Antarctic Ice Sheet
Further south, the Western Antarctic Ice Sheet contains much more ice locked up on land than on the Antarctic Peninsula, and changes in the much larger glaciers draining it into the Amundsen Sea (e.g. Pine Island Glacier and Thwaites Glacier) are the main concern here. If those glaciers fail as buttresses, the impact on sea level rise could be much greater than from the Antarctic Peninsula.
The West Antarctic Ice Sheet is also a “marine ice sheet”, which means that its base, although inland, actually lies below sea level. This may make it particularly susceptible to a “runaway” effect if the ice shelves buttressing its flow into the ocean weaken, potentially allowing the ice that is currently inland to become afloat and thereby drive up sea levels substantially (Joughin & Alley, 2011).
The floating end of Pine Island Glacier already appears to be thinning and retreating (e.g. Wingham et al., 2009), as a result of warm deep water upwelling to melt its underside (Jenkins et al., 2010). As a result of such changes, the amount of ice sliding from land into sea from the Western Antarctic Ice Sheet has increased, and already contributes around 10% of the observed rise in global sea level (Rignot et al., 2008). If all the ice in the West Antarctic Ice Sheet ended up in the ocean (perhaps unlikely, though it has declined substantially in the more distant past, e.g. Pollard & DeConto, 2009), there’s enough ice there in total to raise global sea level by around 3.3 metres (Bamber et al., 2009).

Changes to the East Antarctic Ice Sheet
On the other side of the Antarctic continent, the even larger East Antarctic Ice Sheet contains yet more ice on land – more than ten times the amount locked up in the West Antarctic Ice Sheet. The good news here is that it appears to be stable – in fact, increased snowfall over central Antarctica means that the East Antarctic Ice Sheet is actually gaining mass at the moment (King et al., 2012). And where it drains into the sea via glaciers, there aren’t upwelling warmer waters flowing close inshore to erode the floating ends of the glaciers and the floating ice shelves that buttress the ice flow.
There is one exception, however: at the Totten Ice Tongue, there are seafloor channels bringing warm deep waters to the underside of the floating end of the glacier, causing it to get thinner (Rintoul et al., 2017). That may be unique for a glacier draining the East Antarctic Ice Sheet, but the “catchment area” of land ice for the Totten Ice Tongue is almost as large as the whole West Antarctic Ice Sheet, so changes in Totten alone could make quite a contribution to sea level rise (and there’s a useful Nature news feature about the “sleeping giant” of Totten here).
How does all this affect us?
Changes in the Antarctic are not the only factor contributing to global sea level rise, of course. Roughly half of the currently observed sea level rise (which is around 3 mm per year total at the moment) comes from thermal expansion of the ocean – as the ocean absorbs heat from the atmosphere, its volume of water expands as it gets warmer. And changes in other ice sheets and glaciers elsewhere in the world, such as Greenland, also contribute to sea level rise.
Predictions of sea level rise by the year 2100 for the Intergovernmental Panel on Climate Change are almost as much as 1 metre from 1990 levels, depending on how much greenhouse gas we continue to add to the atmosphere (and there’s an excellent set of slides explaining those predictions here). But scientists are still trying to understand how ice sheets, particularly in the Antarctic, could contribute to sea level rise. A recent study suggests that Antarctic ice sheets alone could drive a metre of sea level rise by 2100 (DeConto & Pollard, 2016), while others scientists are examining whether such rapid changes are physically possible (Ritz et al., 2015).
More than 300 million people live in coastal areas already being affected by or at risk of impacts from predicted sea level rise, including 130 coastal cities each with more than 1 million inhabitants. But sea level rise isn’t the same everywhere, like adding water to a bathtub – instead, its effects will vary on different coasts, for example as water sloshes around the oceans through currents and local variations in gravity. A new analysis shows which coasts are connected to changes in particular ice sheets – with changes in the Antarctic Peninsula being particularly relevant for Sydney, Australia (Larour et al., 2017; and here’s an interactive website from that research that allows you to explore how different cities are affected by sea level changes from ice in different areas).
Unless we adapt for predicted sea level rise with new defences and relocations, the financial costs in damages from storm surges and coastal flooding each year could total nearly ten percent of the world’s Gross Domestic Product by 2100 (Hinkel et al., 2014). Even if you don’t live near the coast personally, you will be affected by sea level rise through the global economy. So although the processes involved are complex, what’s happening right now in the Antarctic – along with changes in other places where ice drains from land into the ocean – affects us all.
I’d like to thank the BBC Natural History Unit’s Blue Planet II team for the opportunity to join their Antarctic expedition, and the ship’s crew, sub team, and expedition members aboard the Alucia, whose hard work gave us a new view of life on the ocean floor around Antarctica, and the chance to collect some more data to help scientists understand how the environment is changing there.
There are days when I love my job, & today was one of them, thanks to the hard work of the whole team aboard the research ship #Alucia pic.twitter.com/mTb5Mk9Pjr
— Dr Jon Copley (@expeditionlog) December 14, 2016
The post Exploring environmental changes in the Antarctic with Blue Planet II appeared first on Exploring our Oceans .
]]>The post Blue Planet 2 | Episode 6 | Coasts appeared first on Exploring our Oceans .
]]>
We have a tendency to take our coastlines for granted. It is by far the most accessible and relatable marine habitat, with thousands flocking there every day for their primary source of food, watersports, or just to relax. The UN estimates 40% of the world’s population live in coastal areas. They provide the most extensive economic and social benefits of any natural habitat, encompassing 77% of the services provided to us by all ecosystems. It is where most of us began our love for the sea. In the UK, you are never more than 70 miles away from it. Yet it is easy to forget it is a place of extremes, and as important as any other marine habitat.

Coastal species have to endure excruciating changes in their environment twice a day. Marine animals can be categorised based on their preferences and adaptability to two primary conditions: temperature and salinity (‘saltiness’). A change in salt might be nothing to one of us as we are osmoregulators (we regulate our internal environment) – for an osmoconformer, like a sea cucumber or starfish, this can be devastating. Too little salt, and your internal water diffuses out, and too much, and outside water will pass in until your cells burst. In the ocean, these conditions remain relatively stable – you can assume that they are unlikely to change dramatically in the next few metres, or few hours. However, if you live in the intertidal zone, you are likely to be bombarded with really hot temperatures at low tide, dramatic changes in salinity if you live in an estuary or at a river mouth, and running out of oxygen if you are caught in a rockpool. To make matters worse, the coast itself is constantly shifting, as shown in the programme. You have to be very hardy and resilient to live here.

Coastal management is a huge challenge anywhere in the world – there is always a trade off between using the coastline for economic and recreational ventures, but not at the sacrifice of the coast’s ecology and longevity. Although only covering 20% of the Earth’s surface, 41% of the world’s population are coastal inhabitants. For example Guyana, a country larger than the UK, 90% of its population lives on a narrow coastal plane, and only a narrow sea wall protects its inhabitants from the ocean. 21 of the world’s 33 megacities are found on the coast, including Tokyo, Lagos, New York and Buenos Aires. With a globally increasing population, how do we ensure coastlines are sustainably developed and not overxploited?
I have noticed that the UK’s coastlines are a severely underrated habitat among many wildlife enthusiasts. Since the establishment of Lundy Island as the first MCZ (Marine Conservation Zone) in January 2010, a total of 50 sites now make up an area the same size as Wales. These are designated to protect rare and threatened species, and also the wide diversity of life found here. We were lucky enough to conduct some camera drop surveys of the maerl beds of the Fal Special Area of Conservation – a red calcareous algae, superficially similar to corals – of which the UK has in several locations. Maerl can be up to 8000 years old, and provide habitat for rare species like Couch’s goby, much like coral reefs do in the tropics. Additionally mudflats, estuaries and sandbanks are not the most glamorous marine habitats but have still been highlighted for conservation as part of global efforts to conserve biodiversity. Just as an example to the importance of this Blue Belt initiative, seagulls are a red list species in the UK due to their overall declines across the country due to habitat loss. This will come as a surprise to many. They are widely considered pests as they have been increasing in urban areas, partly because of abundant food, and partly because they have nowhere else to go.
Appreciating and conserving the marine environment does not just encompass tropical coral reefs, the great whales of the open ocean and the polar ice caps that many of us will only ever admire through a screen. Declines in biodiversity are all-encompassing and are essential for the future of habitats, and ultimately, our own wellbeing. We in the UK are just as responsible for protecting our marine species as any other country, and you don’t have to fly to the tropics to be close to the Blue Planet.
The post Blue Planet 2 | Episode 6 | Coasts appeared first on Exploring our Oceans .
]]>The post Mapping the deep, and the real story behind the “95% unexplored” oceans appeared first on Exploring our Oceans .
]]>One topic we’ll look at in Week 1 of the course, “A hidden landscape”, is how we map the ocean floor, and how much has been mapped at different levels of detail. So the publication of a new ocean floor map this week, created from satellite data by David Sandwell of Scripps Institution of Oceanography in San Diego and colleagues, is very timely.
We’re often told that we know more about the surface of Mars / the Moon / Venus (delete at whim) than the depths of the ocean, and that 95 percent of the ocean is “unexplored”. That makes for a great meme, and there’s a nice infographic out there on social media to illustrate it:
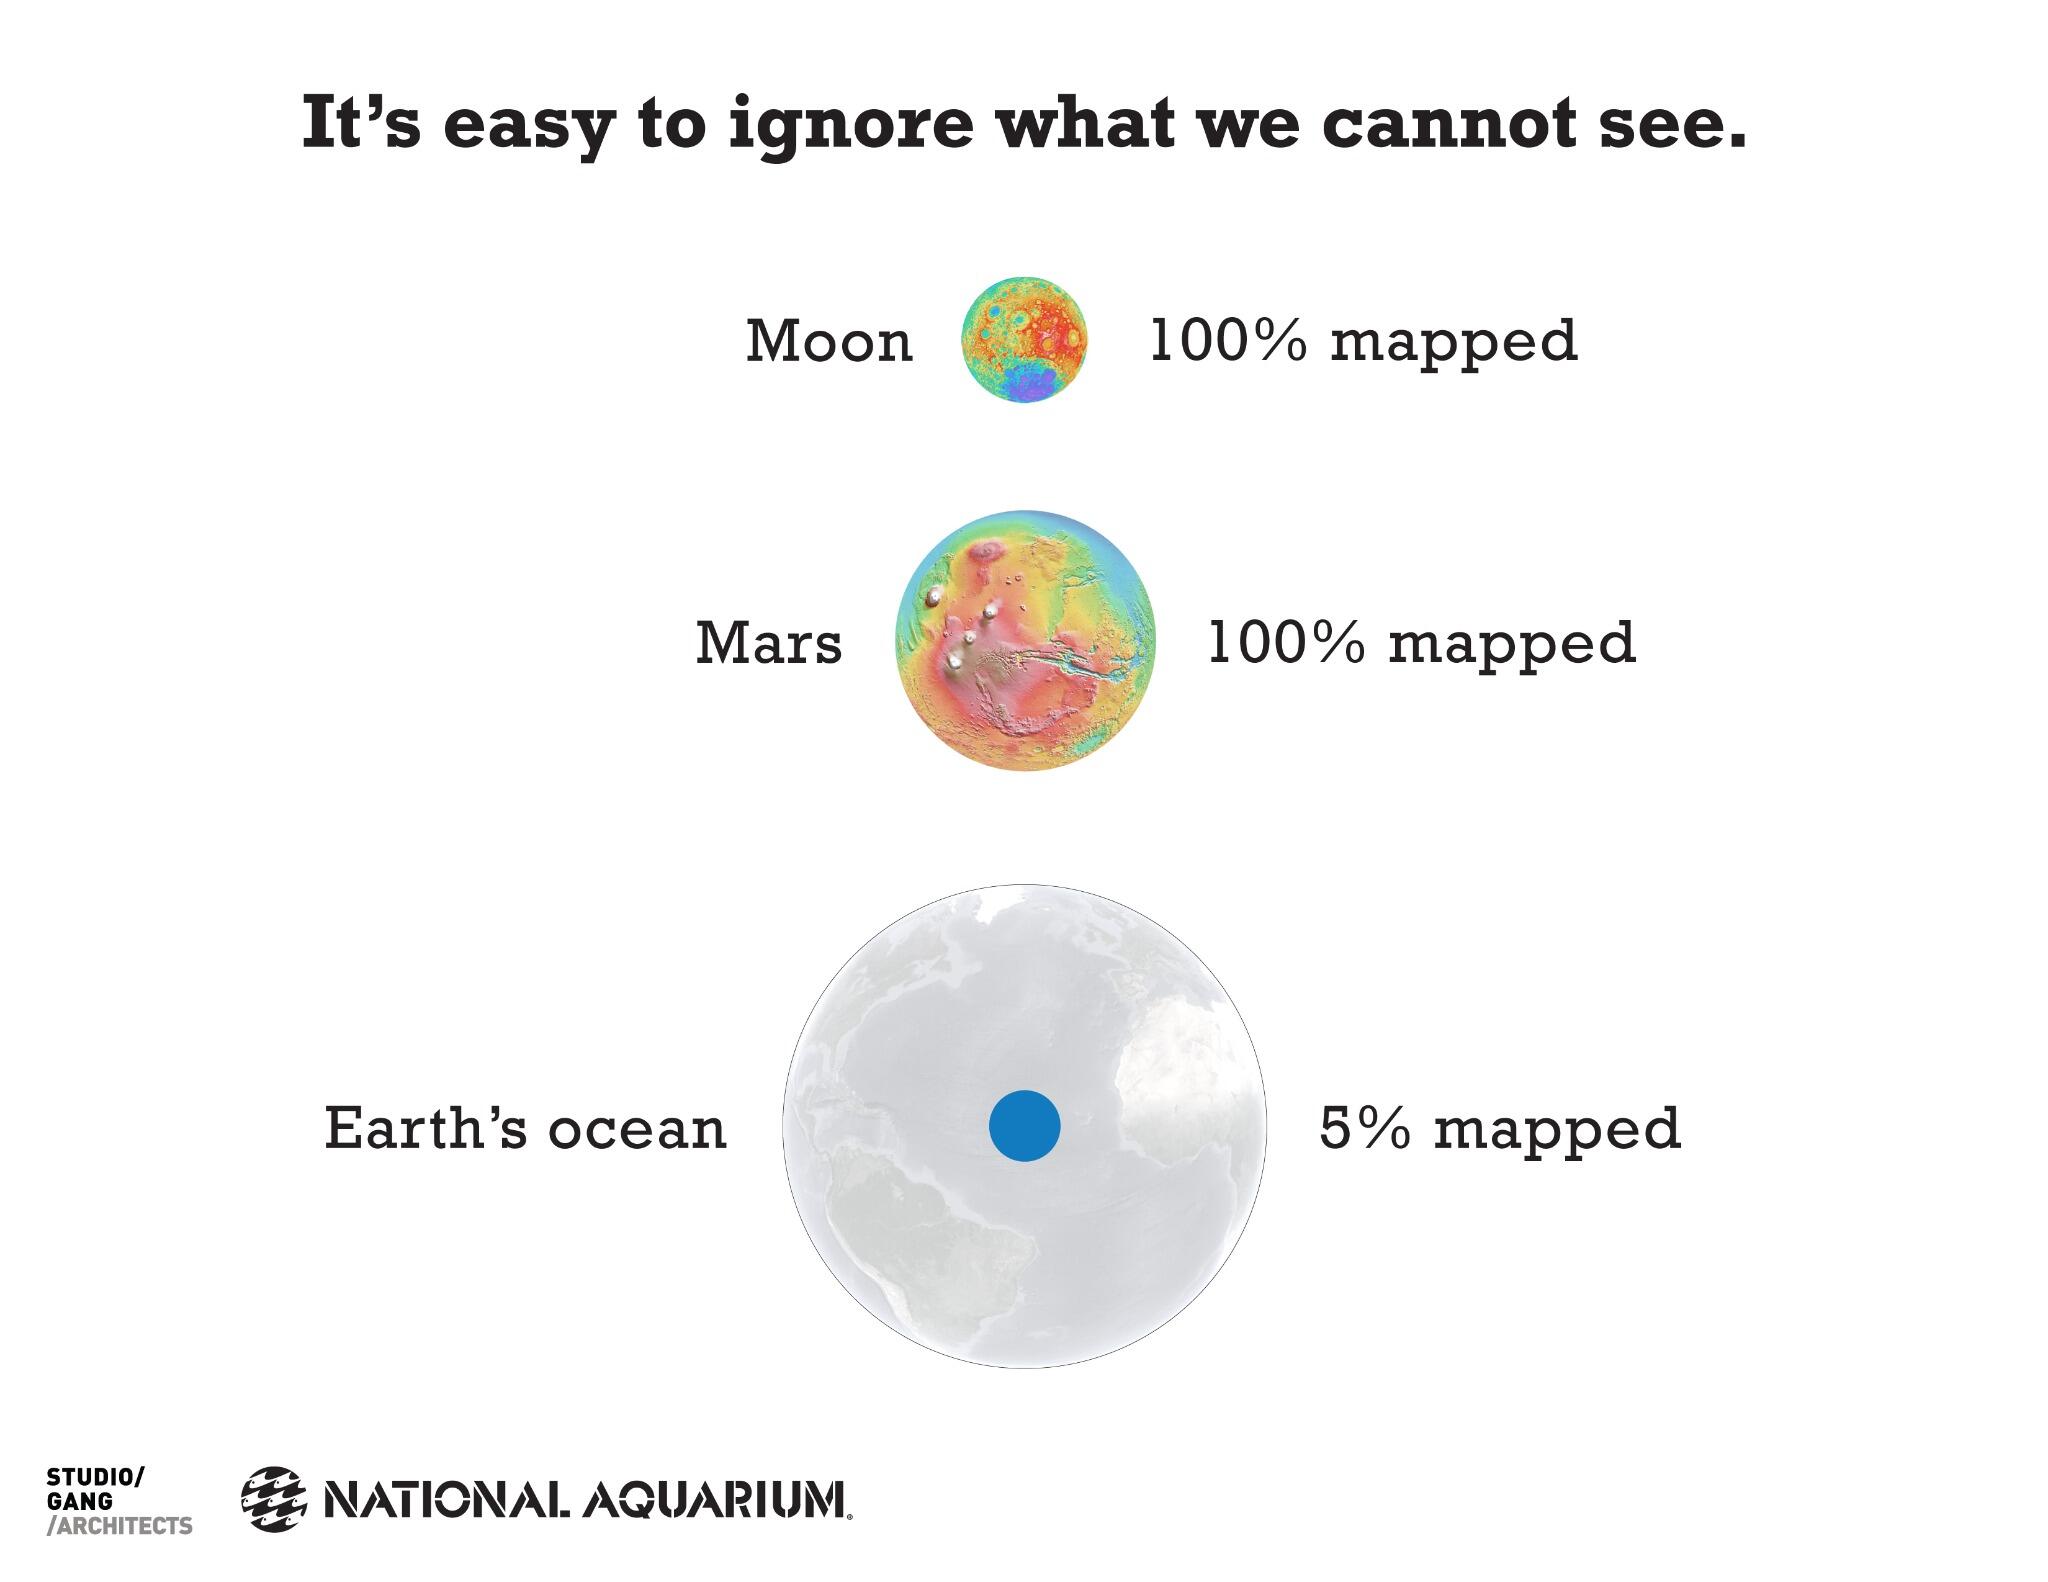
But it’s not quite the full story: in some ways, we have come much further than “five percent mapped”, but in other ways we still have far to go. It all comes down to what we mean by “explored”, and how we map the ocean floor. So let’s examine some of the facts behind the “95 percent unexplored” meme and those comparisons with our celestial neighbours.
The entire ocean floor has now been mapped at up to ~5 km resolution, which means we can see most features larger than ~5 km across in those maps. That’s the resolution of the new global seafloor map, which uses some nifty tricks with satellites to estimate the landscape of the seafloor, and even reveals some features of the Earth’s crust lurking beneath seafloor sediments. And the previous global map of the ocean floor, created using the same techniques and published in 1997, had a resolution of ~20 km.
Unlike mapping the land, we can’t measure the landscape of the seafloor directly from satellites using radar, because seawater blocks those wavelengths of electromagnetic radiation. But satellites can use radar to measure the height of the sea surface very accurately. And if there are enough measurements to subtract the effects of waves and tides, satellites can actually measure bumps and dips in the sea surface that result from the underlying landscape of the ocean floor.
Where there is a large underwater mountain or ridge, for example, the tiny local increase in gravity resulting from its mass pulls seawater into a slight bump above it. If instead there is an ocean trench, the weaker local gravity produces a comparative dip in the ocean surface.
It’s an astounding feat of precision measurement, involving lasers to track the trajectory of the measuring satellite, calibrations with local gravity measurements made by ships, and inevitably quite a bit of maths in processing the data. The new map uses data from the Cryosat-2 and Jason-1 satellites, and reveals features not seen in earlier maps using data from older satellites. You can explore the latest map for yourself here, including downloads to show it in Google Earth.
So we do actually have a map of 100 percent of the ocean floor at up to ~5 km resolution; in that sense, it is certainly not just “five percent mapped”. But that global map of the ocean floor is admittedly less detailed than maps of Mars, the Moon, or Venus, because of our planet’s watery veil.
NASA’s Magellan spacecraft mapped 98 percent of the surface of Venus at ~100 m resolution. The entire Martian surface has also been mapped at ~100 m resolution, and just over 60 percent of that planet has now been mapped at ~20 m resolution. Meanwhile, selenographers have mapped all of the lunar surface at ~100 m resolution, and now even at ~7 m resolution.
To map the ocean floor back home in greater detail, we have to use sonar instead of satellites. Multibeam sonar systems aboard ships can map the ocean floor at ~100 m resolution, but only in a track below the ship. Those more detailed maps now cover about 10 to 15 percent of the oceans, which is an area roughly equivalent to Africa in size. And along with older, single-beam echosounder data from ships crossing the ocean (which were the source of data for the earlier famous “World Ocean Floor Map” by Marie Tharp and Bruce Heezen), we have “soundings” for a total of perhaps around 20 percent of the ocean floor.
You can explore some of the recent shipboard multibeam map coverage for yourself at GeoMapApp: if you zoom all the way in on the map, you can the tracks of ships that have mapped areas at higher resolution than the satellite base map (but please don’t misinterpret the sometimes grid-like patterns of ship’s survey lines as the streets of Atlantis).
Mapping at the level of detail achievable by shipboard sonar systems still reveals plenty of surprises. The first phase of searching for Malaysian Airlines flight MH370 in the Indian Ocean, which has involved mapping from ships to plan future surveys by underwater vehicles, has revealed new seamounts and other features that were not visible on satellite-derived maps of the area.
And on a personal note, in 2009 I was aboard an expedition near the South Sandwich Islands in the Southern Ocean when our ship’s sonar revealed a seafloor crater, 4 km across and 1.6 km deep, that wasn’t on any satellite maps. We later found some very unusual deep-sea vents and a “whale fall” at the bottom of that crater too, but that’s a story for another time.
However, if we want to detect things just a few metres in size on the ocean floor, such as the mineral spires of deep-sea vents or the wreckage of missing aircraft, we need to take our sonar systems much closer to the seabed using underwater vehicles or towed instruments. At present, less than ~0.05 percent of the ocean floor has been mapped to that highest level of detail by sonar, which is an area roughly equivalent in size to Tasmania. And of course, actually to see the seafloor using cameras or our own eyes means getting even closer, using tools such as remotely operated vehicles or manned submersibles.
So the “95 percent unexplored” meme doesn’t really tell the full story of our exploration of the oceans. When it comes to having a large scale map, the ocean floor is perhaps not as unexplored as we might think, with 100 percent coverage at ~5 km resolution and around 10 to 15 percent coverage at ~100 m resolution. That 10 to 15 percent is similar in resolution to the current global maps of Mars and Venus.
But our exploration of the oceans depends on what we want to know about them. If our questions are “what does it look like down there?” or “what’s going on down there?”, then the area that has been “explored” is arguably even less than the ~0.05 percent mapped so far at highest resolution by sonar.
Philosophically, when it comes to exploring anywhere on our dynamic world, how and when do we decide that somewhere has “been explored”? Do we declare “mission accomplished” once we’ve seen a location for the first time? The local woods where I walk my dog look very different in winter compared with summer, with different species flourishing at different times. Should I have considered them “explored” after my first visit in just one season? Exploring our world starts with mapping, but perhaps doesn’t really have an end.
Jon Copley, October 2014
The post Mapping the deep, and the real story behind the “95% unexplored” oceans appeared first on Exploring our Oceans .
]]>The post Which came first in whales: extreme breath-hold diving or large body size? appeared first on Exploring our Oceans .
]]>But what is really astounding about that huge body is that it grows from a single fertilised egg cell, just as our bodies do, but in much the same time as our bodies do. As I’ll try to explain here, that almost makes blue whales impossible animals. But thanks to the recent sequencing of another whale’s genome, perhaps there is a speculative yet intruiging connection to ponder between large body size in whales and breath-hold diving ability.

To attain its huge size, a blue whale’s body grows very rapidly compared with our bodies. A blue whale calf may have a body mass of around 3 tonnes at birth – and yet the time it takes to develop from a single fertilised egg cell (perhaps less than a year for a blue whale) is not very different to our gestation period of 9 months. And after birth, blue whales probably approach their adult body size by their teenage years, also rather like us.
So blue whales have a phenomenal overall growth rate: from single fertilised egg cell to ~150-tonne leviathan within a couple of decades. And that means that they must experience phenomenal rates of cell division. In general, the individual cells of a blue whale’s different tissues are not substantially larger than those of the same tissues in other mammals, so they don’t get large by having large cells, but by having lots of them (although, as an aside, some of the single nerve cells in a blue whale’s spine are incredibly long, and may stretch by 3 cm per day to grow without dividing).
Cell division involves a risk. Every time a cell copies its DNA during division, there’s a chance of errors creeping into the copy. If an error arises at just one of many key places in the genetic code, it can trigger the development of different forms of cancer (although there are also mechanisms that try to spot the errors and correct them). Every cell division is a roll of the dice – and blue whales therefore seem to roll those dice more times than any other mammal.
So whales embody an apparent paradox for biologists, as this blog post by Carl Zimmer summarises nicely. Whales do get cancer, but if blue whales were just like us, then all of them should have colorectal cancer by the age of 80 (and probably other cancers too), yet most of them do not. Instead, they are an example of “Peto’s paradox”: the observation that cancer rates don’t seem to correlate with larger average body sizes among mammalian species.
Carl Zimmer’s excellent post summarises ideas about how whales might resolve Peto’s paradox, and ends by mentioning not having “a single fully-sequenced genome of a whale or a dolphin for scientists to look at” back in 2011. Well, three years is a long time in the field of genomics, and at last we do! Yim et al. (Nature Genetics, 46: 88-92, 2014) have now sequenced the genome of a Minke whale, and compared it with sequences from a fin whale, bottlenose dolphin and a finless porpoise, along with cows and pigs.
What their comparative genomic analysis shows is that some gene families appear to have expanded in the cetaceans, while others have reduced, compared with pigs and cows. Gene families associated with body hair and sense of taste or smell appear to be reduced in whales. But whales have expanded families of genes involved in combating oxidative stress in cells. Yim et al. suggest that these expanded gene families may be adaptations for prolonged breath-hold diving, which results in hypoxia (low oxygen conditions) in tissues.
During hypoxia, cells accumulate “reactive oxygen species” – potentially damaging forms of oxygen, such as hydrogen peroxide – and Yim et al. show that whales have expanded gene families in particular to cope with reactive oxygen species. Reactive oxygen species are also involved in the development of cancer, and hypoxia tolerance and cancer resistance have been linked in blind mole-rats, which live in low-oxygen conditions in their burrows. So what particularly strikes me initially from Yim et al.‘s study is that whales appear to have expanded families of genes that cope with hypoxia and reactive oxygen species – and they also embody Peto’s paradox.
This then poses a couple of speculative questions: did whales evolve prolonged breath-hold diving ability first, and in doing so acquire expanded gene families to combat oxidative stress, which might then have enabled the evolution of large body size by reducing cancer risk from reactive oxygen species?
Or did the evolution of whales first involve a selection pressure for large body size, resulting in the evolution of expanded gene families to combat oxidative stress, which were then co-opted to enable prolonged breath-hold diving?
In other words, I wonder which came first in cetaceans: prolonged breath-hold diving, or large body size? Estimating the body size of extinct cetaceans from incomplete fossil skeletons is tricky (as is inferring their diving capability), and of course it is possible that the two arose contemporaneously under simultaneous selection. But an analysis by Pyenson & Sponberg (Journal of Mammalian Evolution, 18: 269-288, 2011) indicates that extremely large body size may be a relatively recent phenomenon in the evolutionary history of the baleen whales (which include the blue whale).
There’s a lot of blog-post-arm-waving here, and I’m very conscious of straying outside my own area, into the fields of cetacean evolution and cancer biology. But perhaps it’s interesting to consider whether a reduced cancer risk in whales, implied by their huge body size, might involve a spin-off from their adaptations for extreme breath-hold diving – or vice-versa.
Jon Copley, May 2014
The post Which came first in whales: extreme breath-hold diving or large body size? appeared first on Exploring our Oceans .
]]>The post Onwards and downwards: when ROVs or AUVs are lost in ocean exploration appeared first on Exploring our Oceans .
]]>Always in a Chief Scientist’s mind at sea is the question “what will we do if…”. Those “what ifs” include the weather, medical situations, and problems with any piece of equipment, from the ship’s own hardware to the various tools that we put into the ocean. I’ve never been on an expedition where we were able to stick to “Plan A”, and it sometimes seems like we have more contingency plans than there are letters in the alphabet.
The loss of a remotely operated vehicle (ROV) or autonomous underwater vehicle (AUV) is utterly crushing for those aboard a research expedition and their colleagues ashore. But whenever we send something into the ocean depths, there is never an absolute guarantee that it will come back. There is always a risk involved, although we minimise risk through preparation and manage it in our expedition plans.
The only way to avoid risk completely is not to go at all; some risk will always be there, and that means that sometimes the dice will not roll in our favour. That does not mean we are reckless: an assessment of risk-versus-return is typically part of the funding decision for projects, and our back-up plans are usually carefully scrutinised.
To obtain some kinds of knowledge – particularly when physical samples are required for analysis – there is no alternative to sending equipment into the deep ocean, because the ocean’s watery veil masks its depths from many forms of “remote sensing”. And although we have learned a lot from a century or so of largely “blind sampling” by equipment such as trawls and seabed corers (which are still fine for answering some questions in some areas), we now often require more detailed sampling and surveying, using deep-sea vehicles, to answer further questions.
Here is a quick history of some of the remotely operated vehicles (ROVs) and autonomous underwater vehicles (AUVs) that have been lost in the service of deep-sea exploration – but also what they had achieved, and how the research in which they were involved has continued. Expeditions have continued in the immediate aftermath of such incidents, using other equipment aboard, and in the longer term, replacement and rebuilt vehicles have achieved scientific successes.
We press on, for reasons including the potential benefits that the ocean holds for our future, from new materials to medicines, and to understand our impact on the future of the ocean. So the motto is “ever onwards and downwards”.
HROV Nereus (10 May 2014; Kermadec Trench)
Nereus was a new kind of “hybrid” vehicle, combining ROV and AUV technology into an efficient and cost-effective tool for reaching “hadal” depths, i.e. into the deep trenches, where most other vehicles cannot go. Nereus had already reached the ocean’s deepest point in the Marianas Trench, and more recently dived on the world’s deepest known undersea vents in the Cayman Trough.
The current HADES expedition has provided stunning insights into the Kermadec Trench, and will be able to continue using other tools aboard, such as benthic landers.
Autonomous Benthic Explorer (aka ABE; 5th March 2010; Chile Triple Junction)
ABE was one of the first AUVs to be used routinely for science, coming into service in the mid-1990s and completing 221 missions, including pinpointing hydrothermal vents south of the equator in the Atlantic, and obtaining the first seafloor images of a hydrothermal vent field on the SW Indian Ridge (which my colleagues and I then dived on with an ROV in 2011). The experience gained from developing and operating ABE has also fed into the next generation of AUVs for further ocean exploration.
Isis ROV (19 January 2011; Bransfield Strait, Antarctica)
A day I won’t forget, as one of the team aboard the ship. One year previously, we had used the Isis ROV to study the southernmost known “black smoker” vents in astounding detail. Isis had also surveyed deep-sea canyons off the coast of Portugal, and discovered king crabs creeping up from deep waters towards the Antarctic continental shelf.
The loss of Isis was a major blow, but that expedition continued, using other tools such as a towed camera sled and corers, discovering yet more hydrothermal vents in a seafloor crater near the South Sandwich Islands, investigating volcanic ridges near the Antarctic Peninsula, and revealing how worms boost the flux of iron from deep-sea sediments into Antarctic waters. Those results were a testimony to the leadership of the expedition’s Chief Scientist, Prof Paul Tyler, and the adaptability of the technician team aboard.
(timelapse of ROV Isis rebuild by Jackie Pearson, National Oceanography Centre)
The decision to repair the Isis ROV facility following that expedition was not taken lightly, but the underwater vehicle is not the entire facility, which also includes the shipboard control centre, ROV winch system, and not least the people who operate the facility; so overall, the cost of restoring the vehicle was a fraction of the existing investment in the facility. In the interim, UK expeditions requiring an ROV used Germany’s Kiel6000 ROV through international arrangements for sharing such equipment. A fully restored Isis ROV facility then returned to the Antarctic deep-sea vents in December 2012, and since then has dived on the world’s deepest known undersea vents in the Cayman Trough, and investigated deep-sea corals across the Atlantic.
Autosub-2 AUV (16 February 2005; beneath Fimbul Ice Shelf, Antarctica)
The vast cavities beneath the permanent floating ice shelves that form a fringe around Antarctica and Greenland are some of the few places that only autonomous underwater vehicles can reach. The ice shelves themselves are hundreds of metres thick, and can be hundreds of kilometres long, with water several thousand metres deep beneath them. What goes on in those cavities could be important for understanding the formation of deep waters that sink from polar regions to drive ocean circulation, and they could also be home to unusual colonies of marine life.
Drilling holes through ice shelves and lowering sensors into the hidden ocean below can provide some data, but only in single locations, and at considerable cost in establishing a remote field station on the ice shelf, with all the equipment and fuel required to melt holes down through it. Meanwhile, ROVs can’t reach far into the cavities from the open ocean because of their tethers, so AUVs are potentially the best tools to survey these environments. The Autosub Under Ice programme was therefore designed to explore the marine environment beneath permanent floating ice shelves using the Autosub-2 AUV.
Analysis of previous AUV missions indicated that the risk of losing Autosub-2 during a >100 km mission beneath an ice shelf could be >50%. Consequently, potential insurers of marine equipment quoted an insurance premium equivalent to 95% of the vehicle’s cost, per year! So instead, the programme set aside funds to build a replacement vehicle, and began construction of it, fully expecting that one would be lost.
And indeed it was. Autosub-2 completed its first mission beneath the Fimbul Ice Shelf in the Antarctic, obtaining the first synoptic data from an ice-shelf cavity, but was lost on its second mission (consistent with a ~50% expected risk of loss). However, its replacement was already under construction, and Autosub-3 later completed missions beneath the ice shelf of Pine Island Glacier to understand changes previously observed there from satellite data, and is being used in further ice-shelf studies.
Kaiko ROV (29 May 2003; near Shikoku island)
In 1995, Kaiko – which means “ocean trench” – became the first vehicle to return to the deepest point of the oceans since the record-breaking dive of the Trieste in 1960. Kaiko dived there again in 1996 and 1998, completing more than 20 dives in total to “Challenger Deep” and collecting specimens of amphipod crustaceans, microbes, and sediments. The ROV was also used in the discovery of hydrothermal vents on the Central Indian Ridge in 2000. But in 2003, Kaiko was lost on its 296th dive as Typhoon Chan-Hom closed in towards the research ship RV Kairei.
The “launcher” component of Kaiko, which was recovered, was subsequently combined with the UROV7k vehicle to create Kaiko7000II, with a 7 km depth capability. Meanwhile, the Japan Agency for Marine-Earth Science and Technology (JAMSTEC) has also developed the ABISMO ROV as replacement for Kaiko to reach the deepest point of the oceans – and ABISMO has so far operated successfully to a depth of 9707 metres in the Izu-Ogasawara Trench.
– Jon Copley, 11 May 2014
The post Onwards and downwards: when ROVs or AUVs are lost in ocean exploration appeared first on Exploring our Oceans .
]]>The post MINING AT DEEP-SEA VENTS: WHAT ARE THE IMPACTS ON MARINE LIFE? appeared first on Exploring our Oceans .
]]>Deep-sea hydrothermal vents are one of the seafloor environments now being targeted for mining of their mineral resources, because the “chimneys” that form at vents are particularly rich in metals such as copper that we need for modern technology.
But what are the possible impacts on marine life from mining at deep-sea vents? For the first of three blog posts to accompany Week 6 of our “Massive Open Online Course” on “Exploring our oceans”, I’ll attempt a summary here, because the impact of greatest concern on marine life is perhaps not the most obvious. And because it’s perhaps not obvious, this will be long article – starting with some key features of deep-sea vents, and what mining at vents will involve.
What are the key features of deep-sea vents?
Deep-sea vents are undersea hot springs, where mineral-rich fluid gushes out of the ocean floor. On contact with cold, oxygenated seawater, the minerals in those hot fluids precipitate to build spire-like deposits called “vent chimneys”, and sometimes produce a “black smoke” of suspended particles that rises and disperses above the vents.

Deep-sea vents occur in “vent fields”, each of which is a collection of vent chimneys clustered together in a relatively small area. Vent fields vary in size: some are just a couple of hundred metres across, while at others the vent chimneys can be spread over several kilometres.
Vent fields are separated from each other on the seafloor by relatively large distances where there is no vent activity. In some regions, vent fields can be a few kilometres apart from each other, but in other regions it can be several hundred kilometres from one vent field to its nearest neighbour. So overall, vent fields are rather like “islands”, dotted around the ocean floor, and varying in size and spacing.
The activity of each vent field does not last forever. Depending on their geological setting, some vent fields may only be active for a few decades, before their fluid flow shuts down, for example if the area is smothered by lava flows from nearby undersea volcanoes, or if the “plumbing” beneath the vent field is disrupted by earthquake activity. In other regions, however, a vent field can remain active for thousands of years – and go through cycles of activity, switching “on and off” for several millennia at a time.
So this is a key point that we will come back to later: deep-sea vents are not the same the world over. Some are smaller in area than others, and some are naturally active for thousands of years.

At active vents, microbes thrive by using some of the dissolved minerals in the vent fluids as an energy source, in a process known as “chemosynthesis”. These microbes in turn provide food for species of deep-sea animals, many of which are only found in such “chemosynthetic” islands of life on the ocean floor.
However, those animal species are never unique to an individual vent field, because if they were, they would go extinct when that vent field shuts down naturally. The “vent” animals therefore have larval stages in their life cycles that are adapted for dispersal between vent fields, which allow them to avoid extinction despite the ultimately ephemeral nature of the colonies of their adult forms.

Although vent species are not unique to individual vent fields, however, they are specific to particular regions – one species, for example, may be found at vents along 3000 km of mid-ocean ridge, and then either geological or oceanographic barriers may isolate it from other species at vents in neighbouring regions.
So this is another key point that we will come back to later: vent fields are naturally ephemeral, and may be inhabited by species of animals only found at vent fields in a particular region, but never only at one individual vent field.
What is involved in mining at vents?
From plans already made by mining companies, “mineral extraction” will involve machines on the seafloor scraping up and pulverising the “seafloor massive sulfide” (SMS) deposits at a vent field, i.e. the vent chimneys and associated rubble around them.
This material will be pumped to a surface facility, where the metals will be extracted. The remaining matter will be turned into a slurry, and in some cases may be pumped back down into the depths, to disperse from a pipe in mid-water and eventually settle across a wide area of the seafloor at very low concentration, similar to the fall-out from the natural plume of particles dispersing from the vents themselves.
What marine life will be most affected?
Now let’s think about the marine life that is likely to be most affected by mining at deep-sea vents. Mining on land has an impact on local wildlife, but on land that wildlife usually occupies habitats much larger than just the area being mined. So although some garden snails or earthworms may be killed by an excavation on land, that impact doesn’t usually cause concern, because those species are still common in unaffected areas.
So it is important to make a distinction between “normal” deep-sea animals that are found in extensive habitats beyond deep-sea vents, and “vent” animals that are only found in vent environments.
The plume of particle-laden waste water from seafloor mining could have an impact on “normal” deep-sea animals, for example suspension-feeding corals living on rocky seafloor away from the vents, or mid-water animals if the plume clouds the water (remember that many deep-sea animals still use light to communicate, hunt, and evade predators, even at depths beyond on the reach of sunlight).

But those kinds of animals usually have very wide distributions away from vents in the deep sea, so in terms of habitat loss or species extinction they are not particularly at risk from mining at vents; the impacts on them are similar to those on the garden snails and earthworms of our land-mining analogy. The same applies to animals that may be affected by noise or other disturbance from mining activity, if their species have wide distributions and large populations beyond the impact area.
How will “vent” animals be affected?
But what about the impacts on the “vent” animals, which only live in vent environments? The animals living on vent chimneys macerated by the mining machines will be killed. But vent fields are naturally ephemeral features: when a vent field shuts down naturally, all the animals living there die out. So mining, it is argued, simulates a natural disturbance process at an individual vent field.
In fact, mining does not “switch off” activity at a vent field; instead, it effectively resets the vent field to “time zero” in its natural development, by scraping the seafloor back to bare basalt with hot fluid still gushing out of it. We know that the larvae of “vent” animals can recolonise that site from other vent fields in the region, because they did so when venting at that site first began (though how variable larval supply is, and whether a community will always follow the same pattern of development, is not yet known for vent fields in many regions). And the chimneys grow back too (for example, we have seen chimneys grow several metres in a year between visits to some sites).
So on the face of it, mining at vents might seem an attractive proposition (and the word “sustainable” has even been used by some to describe it). But as is often the case in the natural world, issues arise when we consider cumulative effects across a region, rather than individual sites.
What are the risks to “vent” animals from mining?
In the Western Pacific, where plans for mining at vents are arguably most advanced, most of the vent fields are associated with “back-arc spreading”, rather than being found on mid-ocean ridges. These “back-arc” vent fields can be extensive, for example stretching over kilometres of seafloor in a ring around the summit of an underwater volcano.
At many of these “back-arc” vent fields, it is possible to mine just one part of the vent field, while creating “set-asides” or “reserves” within the same vent field or area, from which animals can recolonise the mined area afterwards.
That is exactly what mining company Nautilus Minerals proposes to do at the Solwara-1 vent field near Papua New Guinea, and they have worked extensively with scientists in the US to understand patterns of gene flow and thereby define what should be effective reserve areas as sources for recolonisation.
Looking at those plans as an independent observer, I think they will work in terms of mitigating the impact on “vent” animals. The mined area should recover, with chimneys regrowing and “vent” animals recolonising them.

But – and it is a very big “but” – not all the vent fields on mid-ocean ridges are like the “back-arc” vent field of Solwara-1. At mid-ocean ridges, would-be seafloor miners are targeting vent fields on “slower-spreading” ridges, such as the Mid-Atlantic Ridge and SW Indian Ridge. Vent fields on a slower-spreading ridges are often much less extensive in size than “back-arc” vent fields such as Solwara-1, and each vent field on a slower-spreading ridge is typically active for several millennia.
The TAG hydrothermal mound on the Mid-Atlantic Ridge, for example, is one of the largest known mid-ocean ridge sulfide deposits, but its main active mound is only ~200 metres across, unlike the chimneys spread over kilometres at Solwara-1. And the TAG mound has been active for at least 20 000 years, in cycles of activity and inactivity each lasting 4000 to 5000 years, revealed by “geochronology” of its mineral deposits.
So at the smaller vent fields on mid-ocean ridges, it is not feasible to create “set-aside” or “reserve” areas within a vent field that is being mined: it will be “all-or-nothing” for that particular vent field, considering the footprint required for machinery on the seafloor. And most importantly: the natural rate of vent-field-wide disturbance on slower-spreading ridges, to which their marine life may be adapted, seems to be once every few millennia.
What we don’t yet know on slower-spreading ridges is how rapidly a colony of “vent” animals develops from “time zero” to become identical to the well-established colonies that we have found so far. We have not yet found a vent field close to “time zero” on a slower-spreading ridge: the ones we have seen so far have large mineral deposits, indicating that they have been active for some time, and their ecology has remained largely unchanged over the decades that scientists have been visiting them, unlike shorter-lived vent fields elsewhere in the world. If early stage vent fields on slower-spreading ridges have a different ecology, then mining of several vent fields in a region could reduce the habitat available for species that only inhabit mature colonies.
So this the main impact of concern for “vent” animals: if mining “resets” vent fields in a region at a much higher rate than they “reset” naturally, then we could see overall habitat loss for some “vent” species particular to that region, and ultimately an increased extinction risk for those species as a result of our activities. So what really matters will be the rate at which we disturb these systems by mining, across a region, compared with their natural rate of disturbance at vent-field scale, and the rate of response of animal colonies to such disturbances on slow-spreading mid-ocean ridges, which we don’t yet know at vent-field scale.
What can be done to reduce the risk of habitat loss and species extinction at vents on slow-spreading mid-ocean ridges?
The most obvious answer to that question is “not to mine those vents”; however, as I will discuss in a further post, the decision has already been made (on behalf of all of us, yet seemingly without us being asked).
If mining goes ahead at active vents on slow-spreading mid-ocean ridges, it is therefore essential that it is carefully controlled at a regional scale, for example identifying a network of vents in a region that must be conserved to ensure viable “metapopulations” of species to recolonise mined sites. And it will take considerably more research and exploration to inform such an approach in each region.

There is also an alternative at this point: for every “active” vent field on a slow-spreading mid-ocean ridge, there are probably at least ten inactive vent fields, where venting has ceased naturally but where the vent chimneys have not yet been buried by sediments. As venting has ceased at these sites, the “vent” animals have moved on – but the metal-rich mineral deposits remain. So potentially, it might be possible to mine inactive vent fields on slow-spreading mid-ocean ridges without the impacts on “vent” animals that we have considered here.
(Recent research shows that marine life at inactive vents can still benefit from chemosynthesis at nearby active vents, but the species involved are “normal” deep-sea animals, typically with wide distributions beyond inactive vents, so they may be similar to the earthworms and snails of our land-mining analogy).
Inactive vent fields may be less attractive to would-be miners, however, because they are harder to find. We find active vent fields thanks to the plume of mineral-rich fluids gushing out of them, but inactive vent fields lack those tell-tale signals. But it could still be possible to restrict mining of vents on mid-ocean ridges in international waters to inactive sites.
Whatever the future, effective regulation will be essential for vent mining; and in my next post, we’ll take a look at the organisation that already exists to regulate vent mining in international waters. And then in the final post, we’ll also take a look at some of the investors and contractors involved in developing the world’s first deep-sea vent mine, in the territorial waters of Papua New Guinea.
– Jon Copley (original post March 2014; updated October 2015)
Supplemental, July 2014:
Two further items relevant to this post, in recent weeks:
(1) At the Council of the United National International Seabed Authority (ISA; responsible for administering seafloor mining in international waters) in July 2014, the Netherlands submitted a note recommending that the ISA consider establishing regional environmental impact assessments before awarding any “exploitation” contracts for seafloor mining. Such a measure, if eventually adopted by the ISA, could address the concerns about “cumulative” impacts of mining at deep-sea vents described here. So let’s watch this space…
(2) Andrew Thaler and colleagues have recently published an analysis of how connected some populations of animals are between deep-sea vents (which Andrew discusses eloquently in a post here). Surprisingly, their new study shows that a “non-vent” animal (Munidopsis squat lobsters, found in lots of deep-sea environments other than just hydrothermal vents) shows greater genetic sub-division than populations of Chorocaris shrimp (which are only known from “chemosynthetic” environments such as deep-sea vents) among deep-sea vents in different areas. So the assertion in the post above that we should be less concerned about mining impacts on “non-vent” animals, because they can live in areas away from vents, may not actually hold true in all cases…
The post MINING AT DEEP-SEA VENTS: WHAT ARE THE IMPACTS ON MARINE LIFE? appeared first on Exploring our Oceans .
]]>The post SHEDDING SOME LIGHT ON THE INTERNATIONAL SEABED AUTHORITY appeared first on Exploring our Oceans .
]]>In my previous post, I outlined some of the possible impacts of mining at deep-sea vents on marine life, and how effective regulation at a regional scale will be essential to reduce risks of habitat loss and potential species extinction.
So for a second post to accompany Week 6 of our “Massive Open Online Course” on “Exploring our oceans”, let’s now take a look at the regulator that already exists for seafloor mining in international waters: the United Nations International Seabed Authority (ISA). As we shall see, its procedures perhaps deserve some scrutiny and constructive critique, given their responsibility for environmental protection of the deep-sea floor.
How the ISA works
First of all, we should note that the International Seabed Authority exists to administer seafloor mining in international waters; it does not actually have a mandate to consider whether seafloor mining per se is desirable or not.
Under the UN Convention on the Law of the Sea (UNCLOS), the deep sea is defined as “the common heritage of mankind”. In other environments – such as the Moon – that same legal definition has been interpreted to prohibit the exploitation of resources, at least for now.
But in the implementation of UNCLOS, “common heritage of mankind” has been interpreted to mean “everybody should get a cut whenever someone makes a buck out of it”. And hence the ISA was created to administer seafloor mining in international waters, not to ask the question “is it a good idea?”. That decision has effectively already been made, in the 1994 Implementation Agreement for UNCLOS. (And if you blinked prior to 1994, you may have missed any public consultation about it).

So here is how the ISA operates: it has identified different types of non-living resources of interest on the seafloor in international waters, and drawn up plans to regulate the development and mining of each of them. So far there are three types of resources covered by the ISA: “polymetallic sulfides” (aka seafloor massive sulfides) formed at hydrothermal vents; “polymetallic nodules” (aka manganese nodules) on abyssal plains; and “cobalt-rich ferromanganese crusts” that form on seamounts.
For each type of resource, there are two phases involved in development and eventual mining: “exploration licensing” and “exploitation licensing”. Contractors apply for these licences, and contractors have to be “credible operators” with applications supported by a host country that has ratified UNCLOS. Contractors so far include companies, research institutions, and government agencies. There are currently 15 exploration licences in operation across all three types of resource, with four more about to be signed (and here is the list of contractors).
(As an aside, the requirement for sponsorship by a nation that has ratified UNCLOS excludes the USA from participating at present, and would therefore seem to exclude US companies as contractors. But multinational companies, even if of US origin, can have subsidiaries in other countries that can apply as contractors, if that subsidiary’s application has the support of a “host” nation that has ratified UNCLOS. UK Seabed Resources Ltd, which is a subsidiary of US giant Lockheed Martin, holds two exploration licences sponsored by the UK government).
Licence applications cover geographical “blocks” of the deep sea, which vary in nature depending on the resource involved (for polymetallic sulfides at vents, for example, an exploration “licence block” is typically a ~1000 km section of mid-ocean ridge; and here is a map with blue blocks showing the four current exploration licence areas for polymetallic sulfides).
Contractors are then required to subdivide their licence block into an area that they will develop themselves, and a “reserved area” of equivalent potential value in which developing nations can operate with the assistance of the ISA, or where the ISA can operate through its own commercial “Enterprise” arm in a joint venture with the contractor.
(And given that the ISA has in principle created a commercial arm with the potential right to operate in licensed areas, it is therefore perhaps in the interest of the ISA to award licences… this structure seems to create a potential conflict-of-interest, from a perspective of environmental stewardship).
Award of a licence can exclude other contractors from operating in exactly the same areas for that resource, but cannot exclude scientists from conducting research there (access to international waters for scientific research is guaranteed under other terms of UNCLOS; it may get interesting, however, if a research expedition turns up for work at a site when a contractor is working there).

“Exploration licences”, which typically last for fifteen years, allow contractors to survey and assess the value of the particular resource in their block area. Some extraction of the resource is allowed, as that is necessary to assess the value of mineral deposits. The “exploration licence” also allows contractors to test and develop technology for future resource extraction. So “exploration licences” do involve actual “mining” activities on the seafloor, which will have environmental impacts. “Exploitation licences” then form a second phase, during which contractors extract the target resource from the areas identified during the “exploration phase”.
Contractors pay fees for their licences (e.g. currently $500 000 up-front for a polymetallic sulfide exploration licence, followed by an annual fee proportional to the area of the licence), which provide an income for the ISA to support the activities of countries that do not currently have their own capability to operate in the deep ocean. And that is how the “common heritage of mankind” is implemented: nations that cannot access deep-sea resources in international waters can thereby receive a share when someone else exploits those resources.
ISA procedures in more detail
Applications for exploration or exploitation licences are reviewed by the “Legal and Technical Commission” (LTC) of the ISA. That committee is comprised of 25 people with “personal qualifications relevant to the exploration, exploitation and processing of mineral resources, oceanography, economic and/or legal matters relating to ocean mining and related fields” (note no explicit mention of environmental qualifications in membership there, beyond the broad term “oceanography”). Those 25 people (and here is a list of the current LTC members) effectively have responsibility for environmental stewardship of 45% of our planet’s surface (the proportional area of international waters) with regard to mining.
The majority of current LTC members, whose five-year term ends in 2016, are geologists or geoscientists, typically with relevant experience from petroleum or mineral prospecting. Most of the remainder of the committee have backgrounds in law, and two current LTC members have backgrounds in environmental science or deep-sea biology.

LTC members are appointed by the Council of the ISA, which includes of representatives of nations that are the potential beneficiaries of the ISA’s activities. The rules for the appointment of LTC members specify that “due account shall be taken of the need for equitable geographical distribution and the representation of special interests”. Some members of the LTC are therefore the nominees of nations with perhaps most to gain from the award of mining licences under current ISA arrangements. Individual LTC members, of course, cannot have any personal financial interest relating to seafloor mining in international waters.
Incidentally, some of the nations sponsoring applications for licences have voluntarily donated funds to cover the travel costs for delegates from developing nations to attend ISA meetings (e.g. see this press release), including meetings where those delegates consider licence applications by those nations. I am not suggesting that arrangement in any way influences the decisions of committee members involved, but it seems an undesirable situation for the independent evaluation of licence applications (and given the overall >$14 million budget of the ISA, which already includes non-voluntary contributions from the same nations).
Overall, I think the ISA could benefit from greater transparency and public engagement. The deep sea is the “common heritage of mankind”, and scientists exploring the deep ocean often go out-of-their way to share what they are finding and doing with wide public audiences, in the spirit of that common heritage. The ISA, in contrast, seems almost hidden away in its headquarters in Jamaica, with a website that is rather impenetrable to non-technical visitors. It does support training bursaries for scientists from developing nations, and convenes meetings and workshops with the scientific community about issues relevant to its work. But as far as I am aware, it has never held any kind of public dialogue about its activities. Given its responsibility to act on behalf of all of us, I hope that the ISA will consider increasing its efforts in wider public outreach.
An ISA anecdote
A couple of years ago, I was interviewed by a journalist writing a feature about mining at deep-sea vents. I took them through the key points summarised in my previous post, including the suggestion that restricting vent mining in international waters to inactive sites could buy us time to develop a greater understanding of vent ecology before considering any mining at active sites.
A few days later the journalist phoned me back, saying that they had spoken to the ISA, and that everything was fine, because the ISA said that only inactive vent fields would be mined in international waters.
I was rather surprised, so I asked the journalist to clarify exactly where that restriction was specified in the ISA regulations for vent mining (having been through them carefully myself, and you can see them here). After querying that point further with the ISA, the journalist called me back to report that the ISA simply expected that contractors would target inactive sites (for various reasons, for which I think there are credible counter-arguments), so the restriction was not made explicit in the regulations.

My concern about some of the procedures of the ISA perhaps took root at that point. If restricting mining to inactive sites at present is desirable on environmental grounds, then that needs to be specified in the regulations. Expecting an industry to regulate itself on such a point is weak, at best (particularly given that inactive sites are harder to find than active ones).
(An attitude of self-regulation perhaps seems to pervade other areas: for example, the responsibility for reporting incidents resulting in environmental damage currently rests with contractors – “A contractor shall promptly report to the Secretary-General in writing, using the most effective means, any incident arising from activities which have caused, are causing, or pose a threat of, serious harm to the marine environment” – Regulations on prospecting and exploration for polymetallic sulphides in the Area, Regulation 35, Section 1; this raises several questions in my mind, not least how “threat” and “serious harm” are to be interpreted or defined).
UN ISA vs UN CBD?
To me, currently there is an even more fundamental issue in the ISA’s procedures. At present, the default outcome for any licence application is that it will be awarded (and if an application is rejected by the LTC, it has two further opportunities to be revised and resubmitted). For a licence application to be rejected on environmental grounds, there must be evidence of likely environmental harm. Specifically: “Prospecting shall not be undertaken if substantial evidence indicates the risk of serious harm to the marine environment” (Regulations on prospecting and exploration for polymetallic sulphides in the Area, Part II, Section 2; my bold-font emphasis added).
That is something of a reversal of the usual “precautionary principle”, whereby evidence of no likely harm is required for an activity to go ahead. And that “precautionary principle” lies at the heart of another UN instrument: the Convention on Biological Diversity (CBD); for example, Principle 15 of the Rio Declaration states that “lack of scientific certainty shall not be used as a reason for postponing measures to prevent environmental degradation.”
Consequently, the principles by which the UN ISA currently operates are potentially at odds with those of the UN CBD. And I will illustrate that conflict with a personal example.
In November 2011, I led the first remotely operated vehicle dives to hydrothermal vents on the SW Indian Ridge, where the Chinese Ocean Minerals Research Agency (COMRA) had already been granted an “exploration licence” by the ISA for the minerals at hydrothermal vents, despite no-one knowing what lived at those vents.
We collected the first samples of vent animals from that region, finding some species previously known from other regions, but also several new species. Although there are certainly more colonies of those new species at other vent fields along the SW Indian Ridge, for now we don’t know where, or how interconnected their populations are. The impacts of any “exploratory” mining activities at the site we visited will therefore be uncertain until we have that knowledge.
Subsequently, I prepared an application for that vent field to be designated an “EBSA” (“Ecologically or Biological Sensitive Area”) under the UN Convention on Biological Diversity. The criteria were clear: the presence of populations of species not yet known anywhere else on our planet, and at potential risk from human activity.
The EBSA application was submitted by the UK delegation at a UN CBD meeting for the Indian Ocean in 2013, and perhaps not surprisingly, award of EBSA status was blocked. I completely understand the reasoning: how could one UN body (the ISA) award China the rights for mineral exploration activities at that site, only for another UN instrument (the CBD) then to designate that same site “ecologically or biologically sensistive” with regard to human activities?
Hopefully, our EBSA application for the SW Indian Ridge vent field has helped to highlight a current gap between the ISA and the principles of the UN CBD. Adding a biodiversity-conservation agreement to the UN Convention on the Law of the Sea is now being discussed, with the deadline for a decision at the end of 2015. The options include establishing a new body to protect deep-sea biodiversity in international waters, or expanding the mandate of the ISA in environmental protection.

Environmental responsibilities in international waters are currently managed by “sector”, for example with separate instruments covering seafloor mining, cable laying, ocean dumping, shipping, and fishing. That disjointed system is not best suited for the ecosystem-based approaches required to manage the impacts of our activities on the oceans, as recently highlighted by the Global Ocean Commission.
Recently some of my colleagues indicated that the International Seabed Authority (ISA) is best suited for the wider task of creating and managing deep-sea reserves for biodiversity, in a comment article published in the journal Nature. The United Nations may indeed be the logical authority to oversee environmental protection in international waters. But personally, for the reasons I have outlined here, I think that some fundamental reforms of the International Seabed Authority will be essential, if it is to be given greater responsibility for the environmental stewardship of our planet’s largest biome.
In the next blog post about deep-sea mining to accompany our free “Massive Open Online Course” (“MOOC”) on “Exploring Our Oceans”, we’ll take a look at some of the investors and contractors involved in developing the world’s first deep-sea vent mine, in the territorial waters of Papua New Guinea.
– Jon Copley, originally posted March 2014, updated October 2015
Supplemental, July 2014:
Soon after this post, the ISA conducted a “stakeholder survey” about deep-sea mining, inviting views from potentially anyone, “to allow the Authority to prioritize issues based on stakeholder responses”. In total, it received 55 responses: 20 were from governments (did your government submit one? And did they ask you about it, before doing so?) and 9 were from mining companies. The ISA is considering holding this consultation open, however, to allow more participation in how it should govern the use of resources in the ~45% of this planet under its jurisidiction.
The post SHEDDING SOME LIGHT ON THE INTERNATIONAL SEABED AUTHORITY appeared first on Exploring our Oceans .
]]>