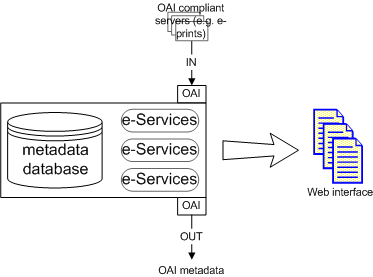
Figure 1: e-Services architecture
The e-Services framework was constructed under the OpCit project with the purpose of providing advanced services over literature data. OpCit provides extensive citation linking over a large collection of papers in the physics discipline (as well as some citation-based services with citebase), which provide scholars with a unique method of efficiently browsing related literature. The e-Services framework extends this functionality by enabling researchers to further understand the relationships between literature, by, for example, requesting the significant papers or a visualisation of their relationships.
Like citebase, the e-Services framework uses the OAI interface to contact various e-print services and download the literature metadata. It then provides advanced services, such as simple visualisations (e.g. number of e-print deposits each year), co-citation visualisations (uses the co-citedness of papers as a proximity measure when plotting papers on a graph), and knowledge services (e.g. most significant papers).

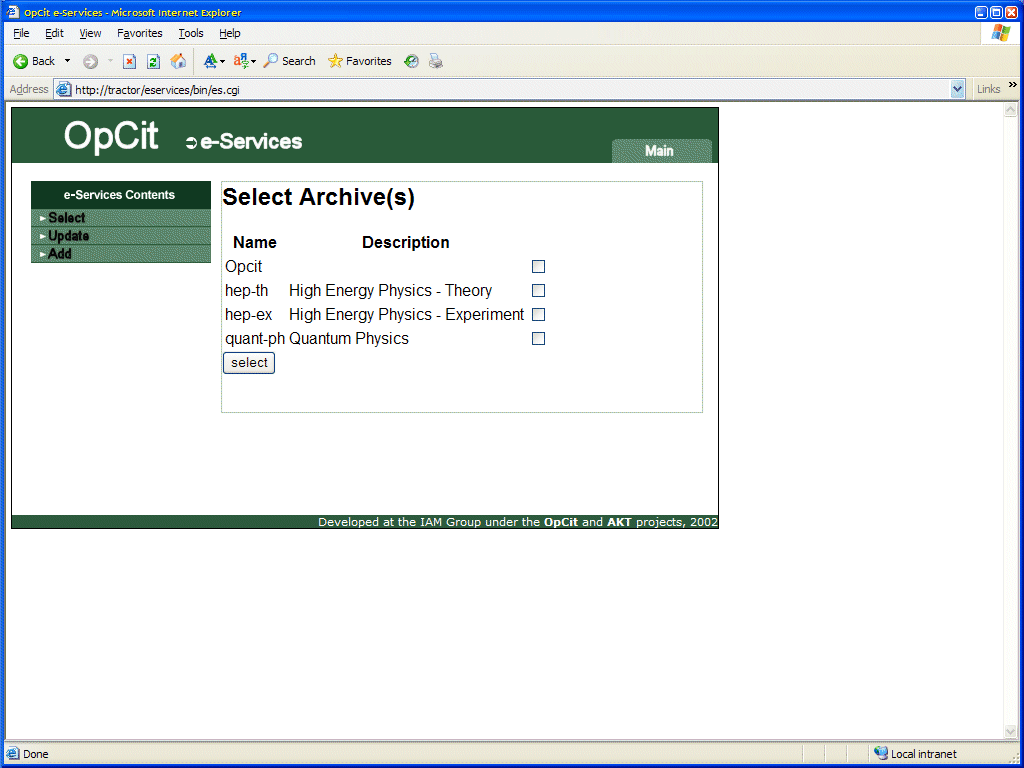
The e-Services administrator decides which e-print archives the e-Services framework contacts and collects metadata from. When the metadata has been collected, the archive is listed and users can select it to explore it further. In Figure 2, the user selects one of the known archives to explore.
 |
Once an archive has been selected, the user can select general (overview) services about it (Figure 3). These services provide answers and graphs on the entire archive, rather than just a single instance.
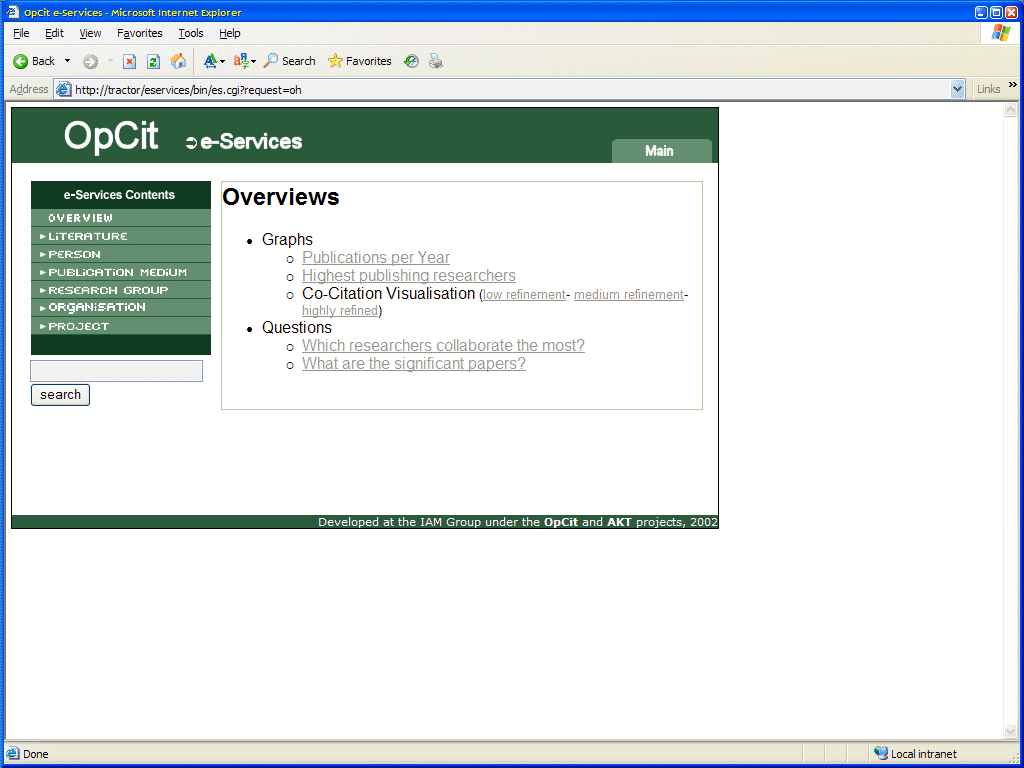 |
Figure 4 illustrates a graph of the publications (deposited) each year for the archive.
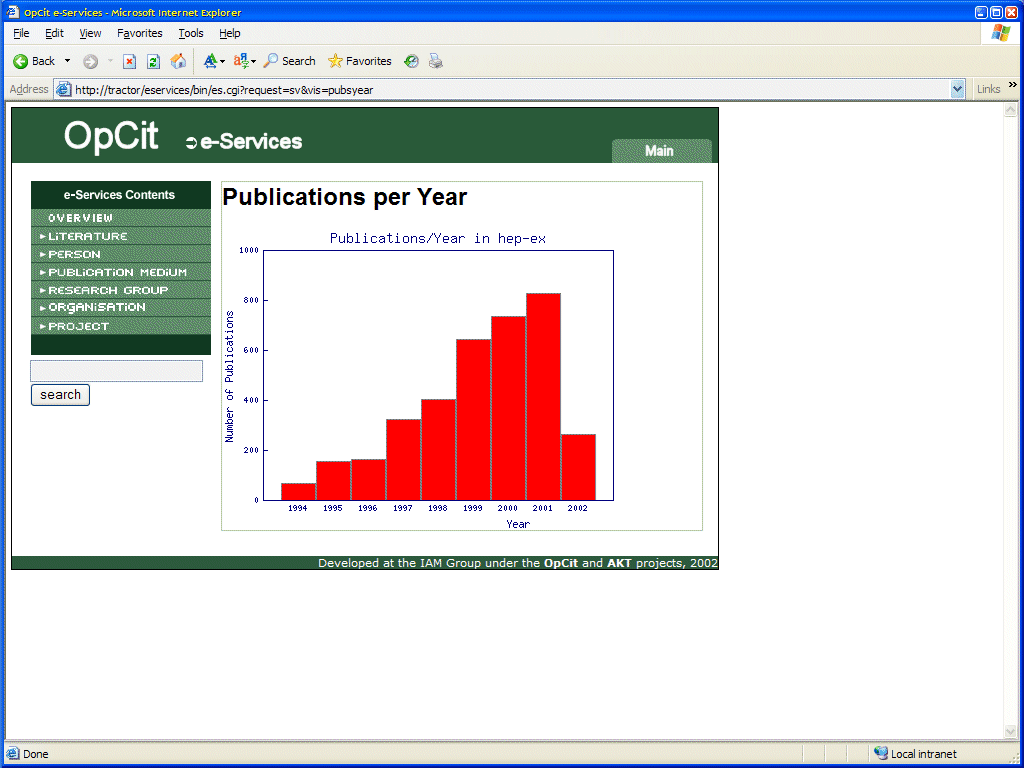 |
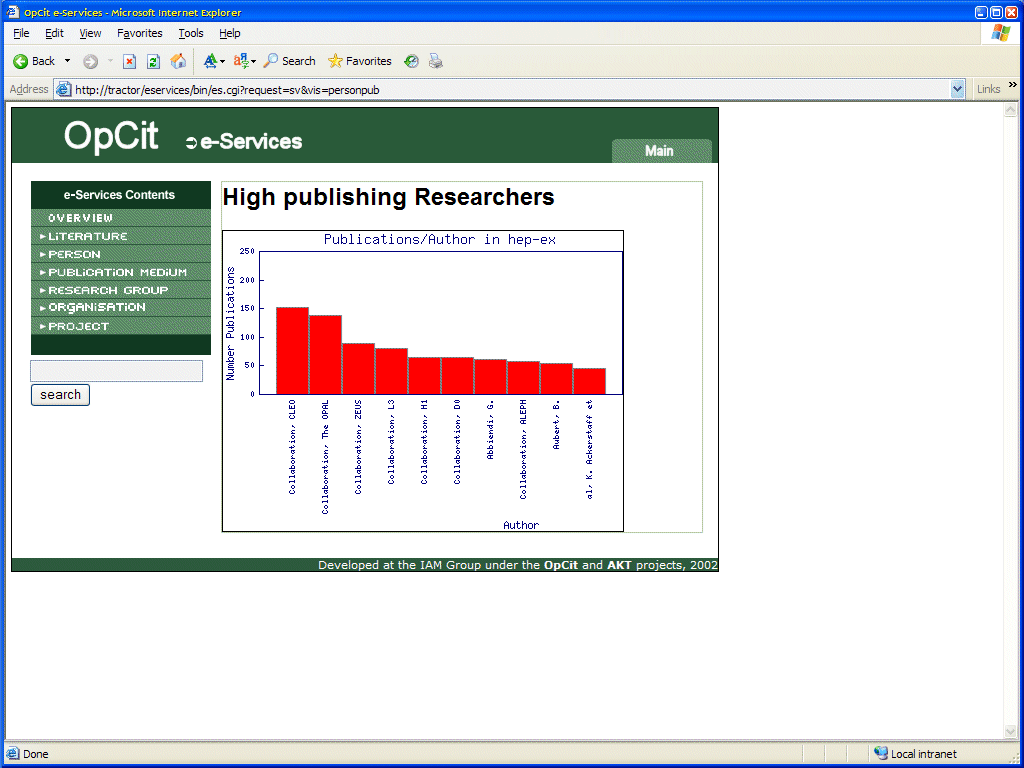
Figure 5 illustrates a graph of the highest publishing researchers in the archive.
 |
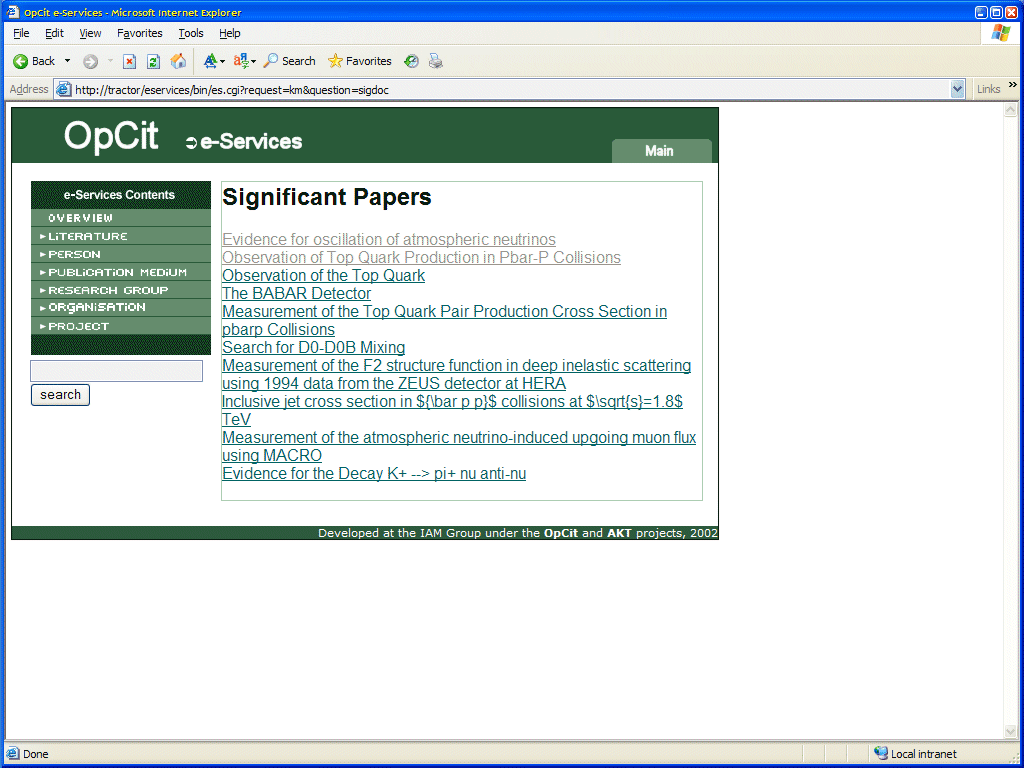
The significant papers (based on citation impact) have been computed for the current archive and presented as a list of linked papers (Figure 6). By selecting a paper, further information on the paper can be retrieved (e.g. author, abstract, co-citations).
 |
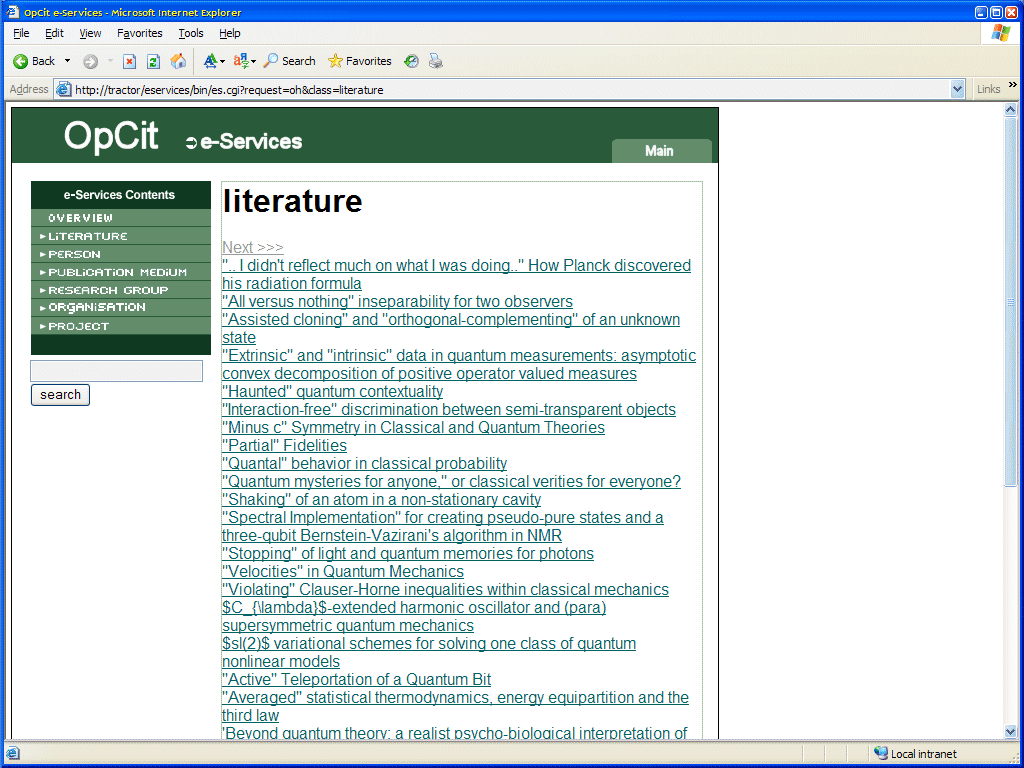
The green-coloured menu on the left of the screen provides links to all instances of a particular type. In Figure 7, all instances of literature in the archive are presented.
 |
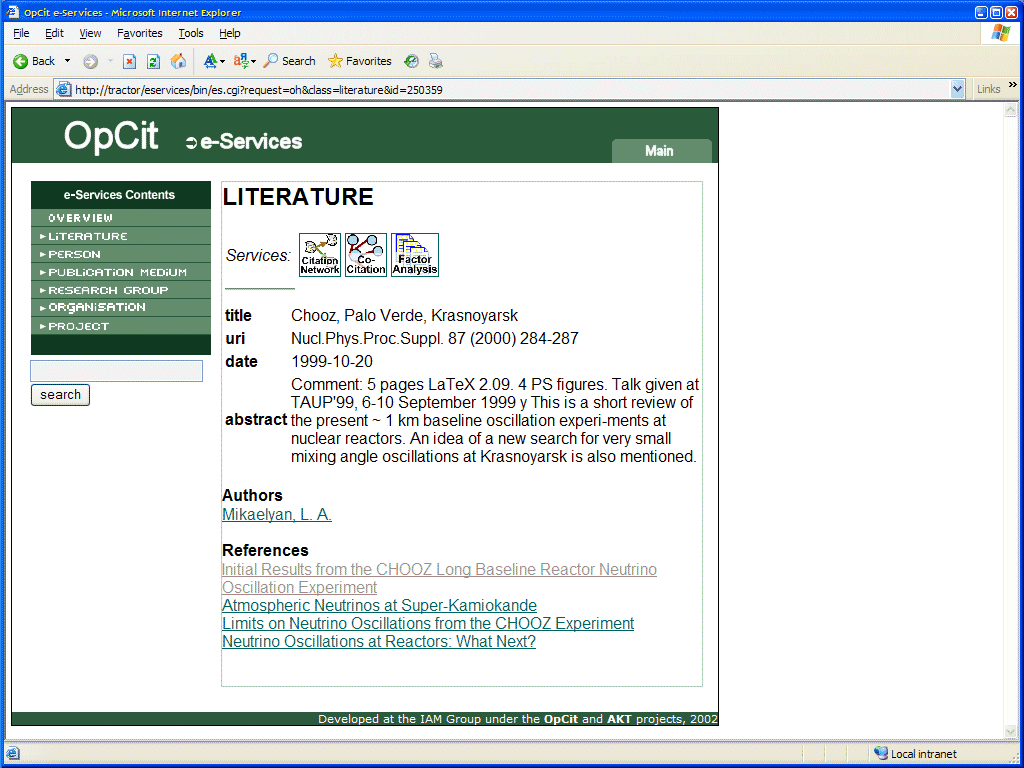
When a particular literature instance is selected, further information on that paper is presented (Figure 8)
 |
When a particular researcher instance is selected, further information on that researcher is presented (Figure 9)
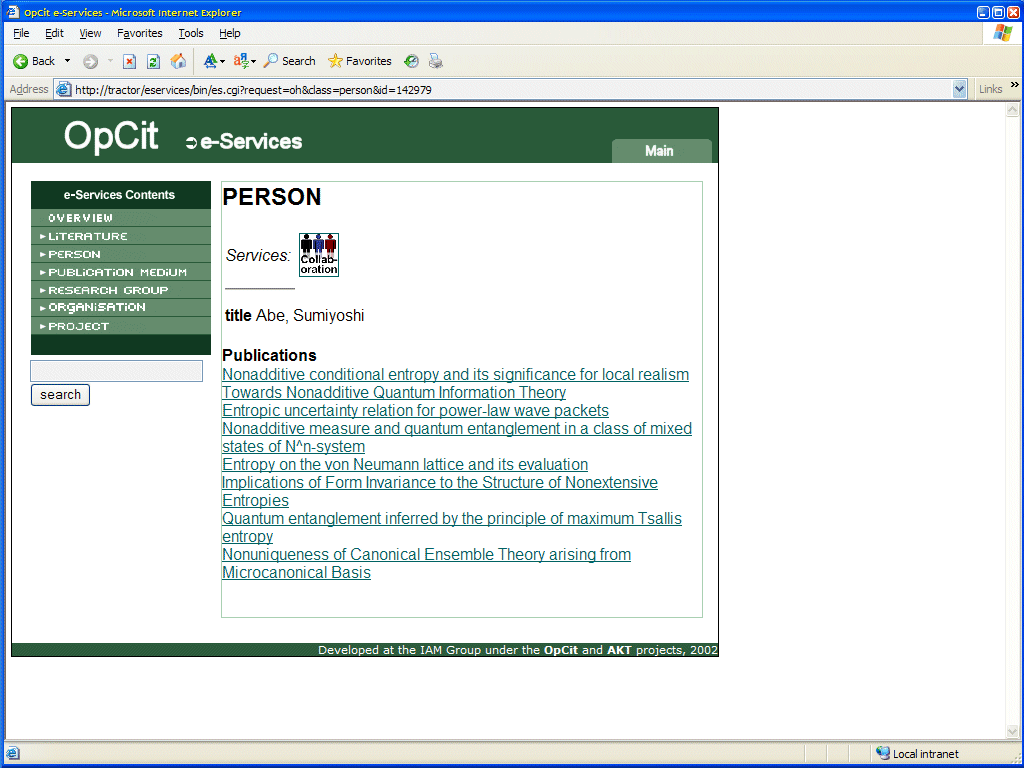 |
When the collaborators for the researcher listed in Figure 9 are requested, five peers are suggested (Figure 10).
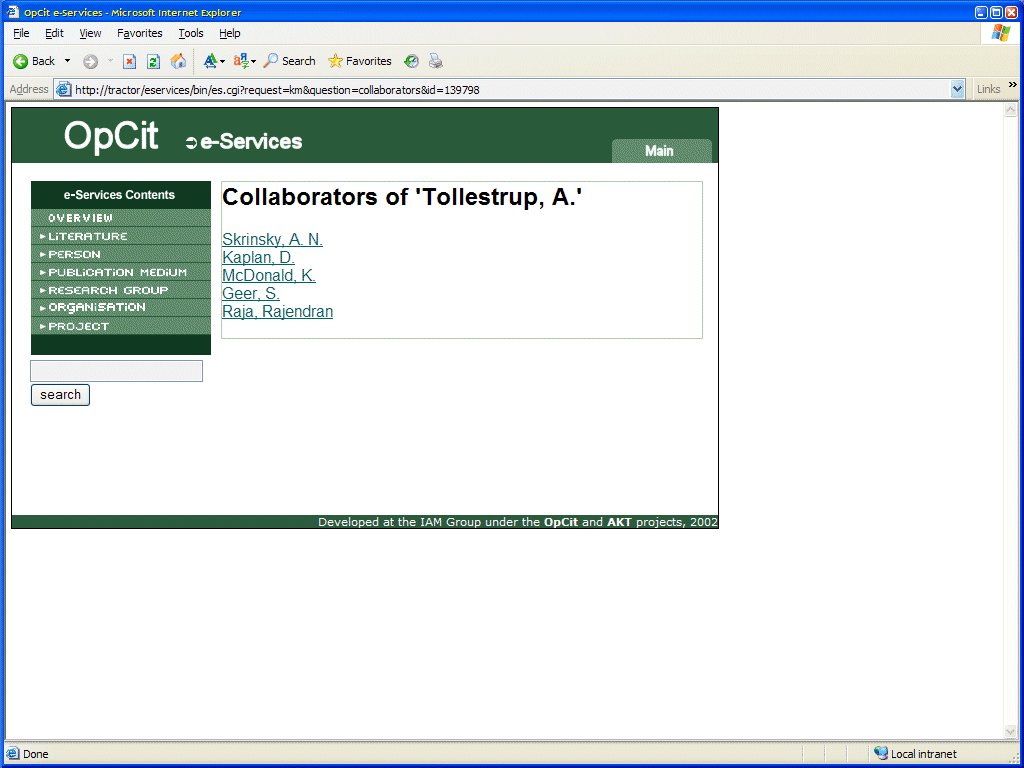 |
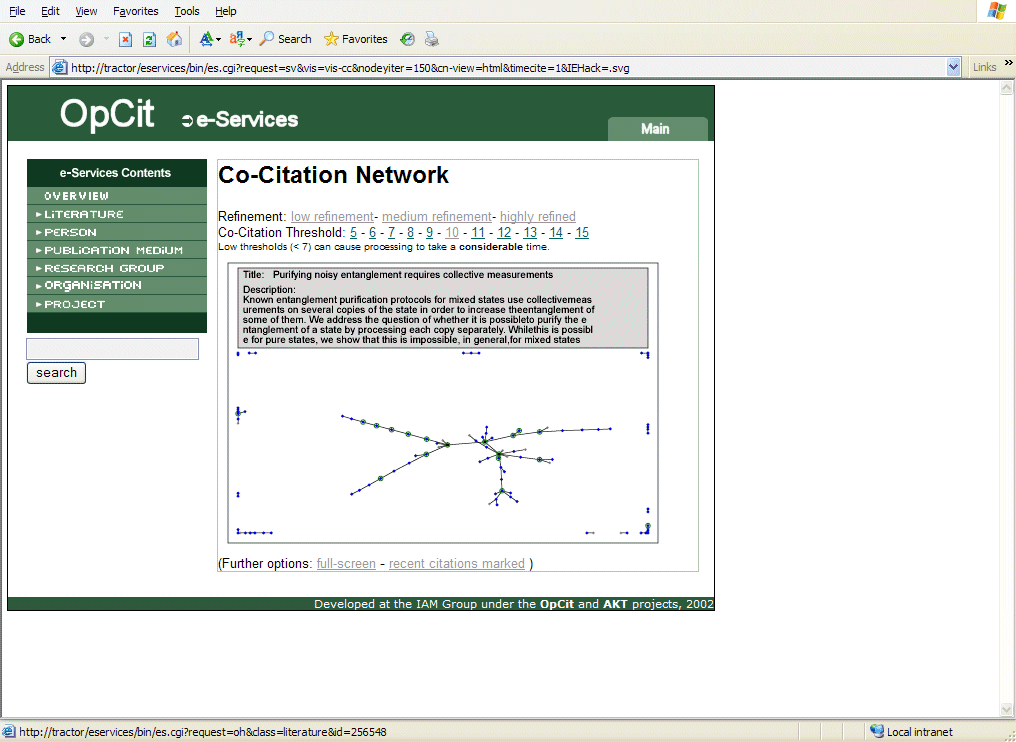
Figure 11 illustrates a small view of a co-citation map for the current archive. Each node represents a paper. An arc between two nodes indicates that these two papers are highly co-cited. A node can be clicked on to enable the user to find out more about a particular paper (e.g. Figure 8).
Various options are available for presenting these graphs. The refinement level determines the number of iterations of the co-citation algorithm. A higher level results in a more "tree-like" (and therefore more effective) graph. The threshold level determines which co-cited papers are included. A level of 10, means that only those papers that have been co-cited at least 10 times are included in the computation. A lower level results in more nodes on the graph, at the expense of greater computational overhead. The graph can also be viewed inside the e-Services interface, or full-screen in its own browser window. Finally, papers that have been recently highly cited, can be marked in red, to help researchers spot active research areas.
 |
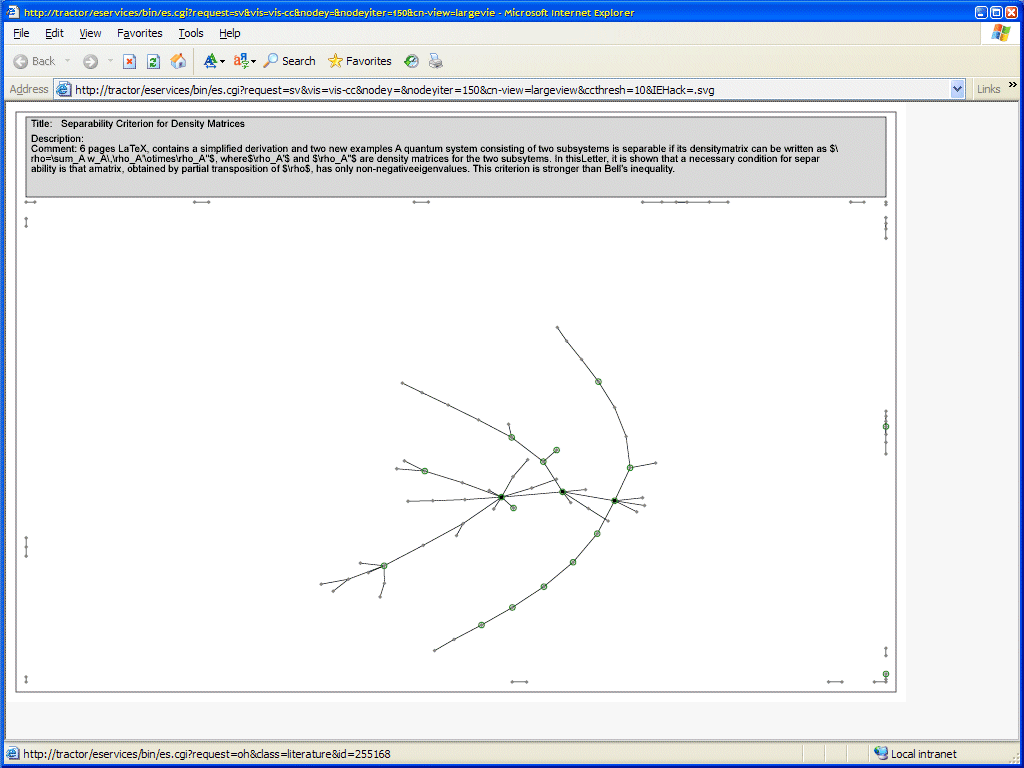
A full-screen co-citation map is presented in Figure 12.
 |
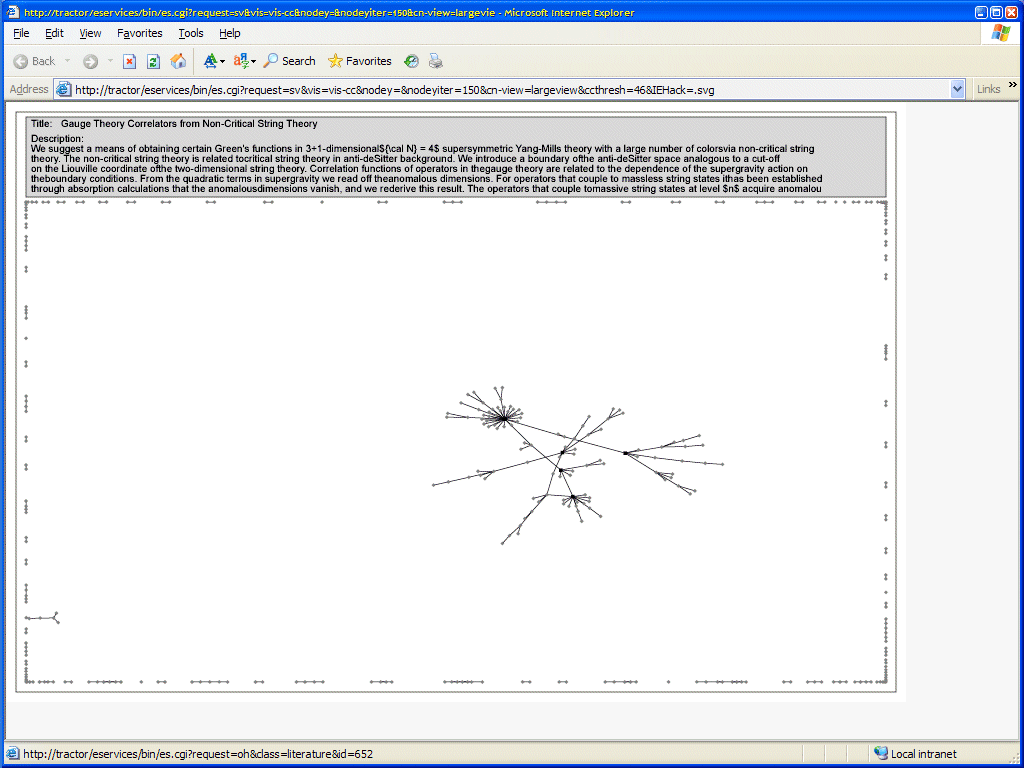
A full-screen co-citation map of the entire arXiv collection is illustrated in Figure 13. Unfortunately, due to the imperfect citation data, as well as the incredible computation power required to produce highly refined graphs, the map is less than perfect.
 |
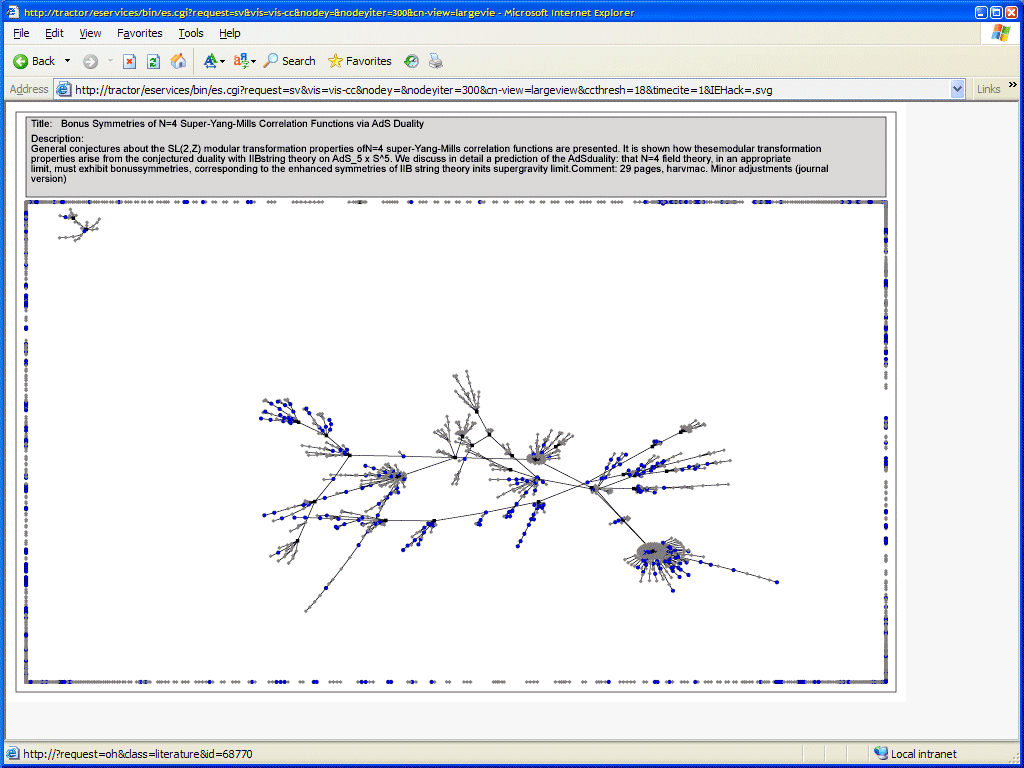
A more refined and lower threshold (full-screen) co-citation map of the entire arXiv collection (Figure 14).
 |
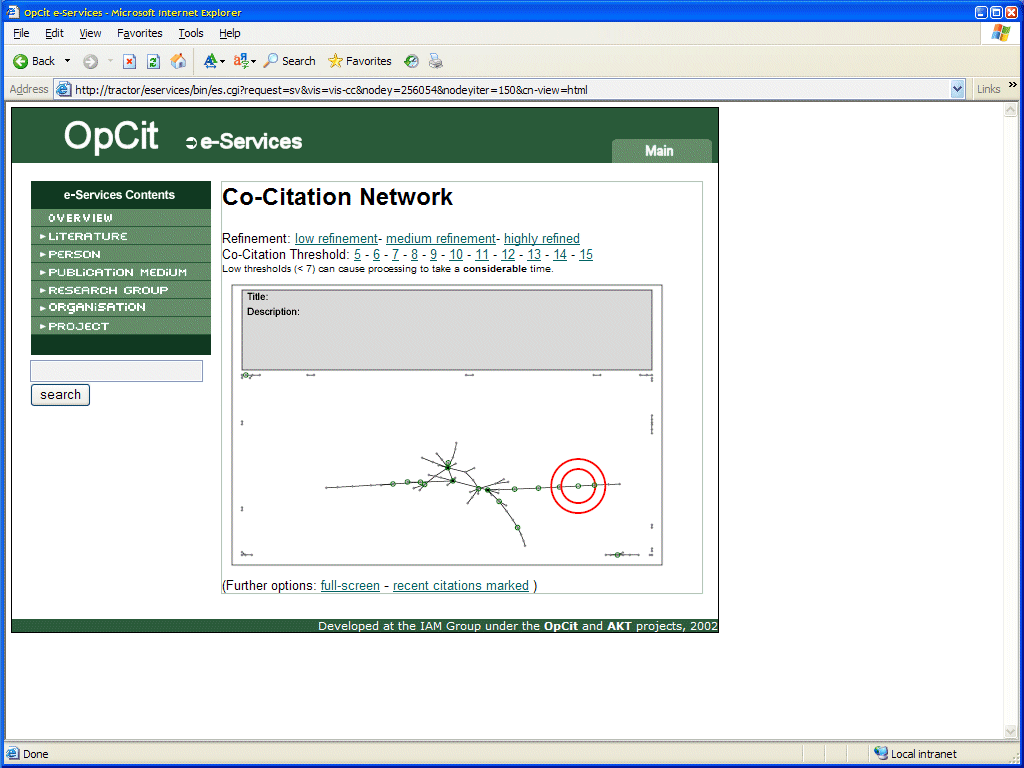
When a co-citation map is produced by selecting the co-citation icon from a literature instance page (e.g. Figure 8), then the resulting map provides a beacon to display where in the map the literature instance is located (Figure 15).
 |
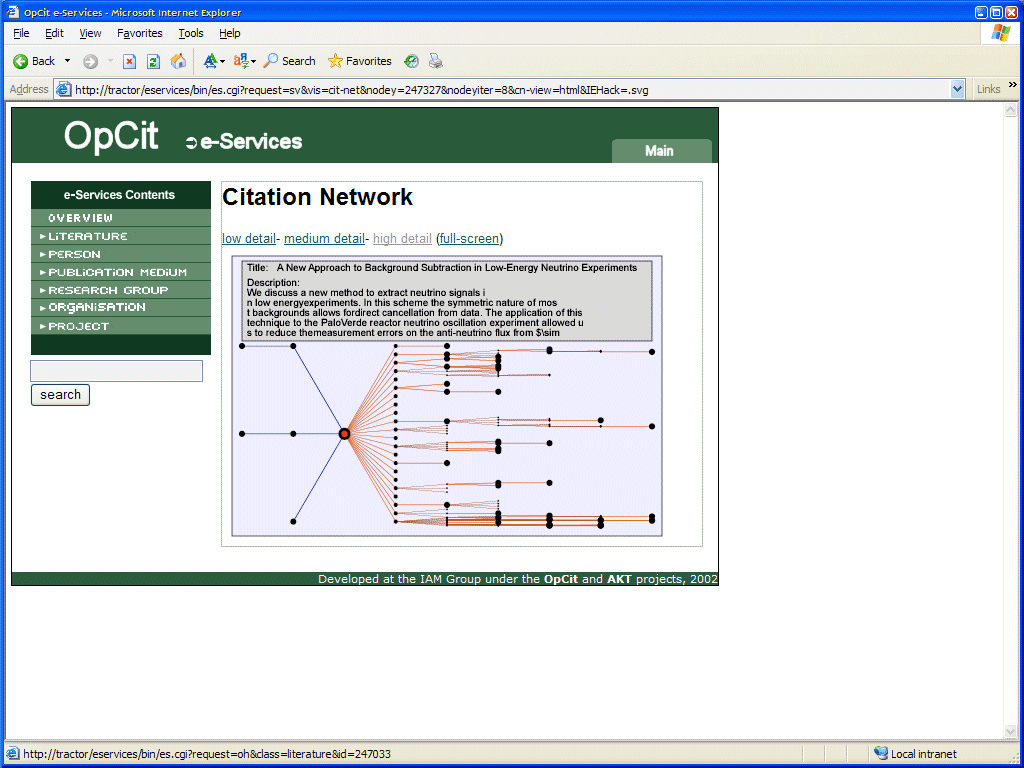
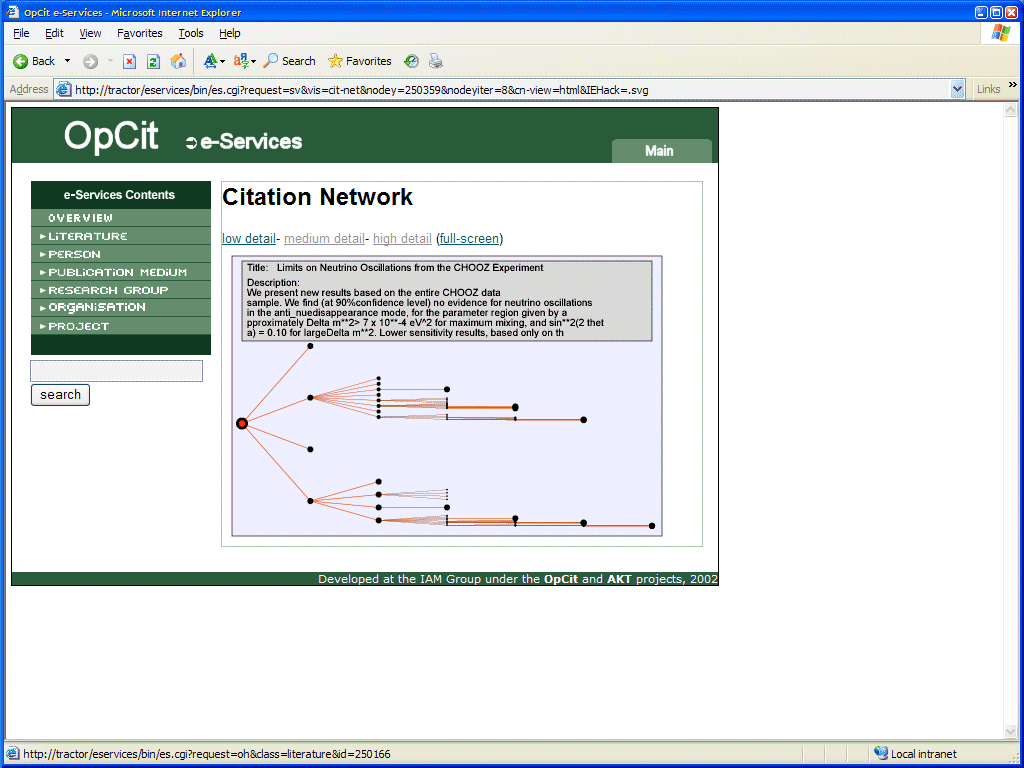
As part of the simple visualisation services, a citation network can be produced (Figure 16). This interactive SVG map presents cited and citing articles. The user can specify the depth to which these articles are presented.
 |
A further citation network example is presented in Figure 17.
 |
For further information please contact Simon Kampa or the OpCit project.