Analysis of Article Authors
Last updated September 07 2000 15:10:18.
(Tables are only available to Soton viewers)
Authors (about 76000 authors)
Authors 2 (Table 1), broken down by area and only having no firstname(slightly less 76000 authors)
Example of same name, different spelling:
4. nucl-th/9810016 [abs, src, ps, other] :
Authors: K. Tsushima (1), D. H. Lu (1), A. W. Thomas (1), K. Saito (2), R. H. Landau (3) ((1) CSSM and The University of Adelaide, Australia (2) Tohoku College of Pharmacy, Sendai, Japan (3) Oregon State University, USA)
Comments: RevTex, 14 pages, 3 Postscript figures, version to appear in Phys. Rev. C, title, abstract, text, references are modified
Journal-ref: Phys.Rev. C59 (1999) 2824-2828
5. hep-lat/9810005 [abs, src, ps, other] :
Authors: Derek B. Leinweber, Ding H. Lu, Anthony W. Thomas
Comments: Revised version accepted for publication includes a new section demonstrating extrapolations of lattice QCD results
Journal-ref: Phys.Rev. D60 (1999) 034014
Example distribution of name format:
| S.W._Hawking | 12 |
| S._W._Hawking | 8 |
| Stephen_W._Hawking | 4 |
| Stephen_Hawking | 3 |
| S.W.Hawking | 2 |
[authors.txt] These names would be collapsed to S.W.Hawking, Stephen_W.Hawking and Stephen_Hawking.
[authors2.txt] These names would be collapsed to S.W.Hawking and S.Hawking.
This data does not include papers submitted before 10/94, as at that time there are no author meta-tags.
Author Citations
Using the citation data provided by Dr. Les Carr, hep-th, 98-00 we can build a table of the number of citations that individual authors have got (disregarding the importance or not of the author). See Table 2.
Then, using Table 1, a mean number of citations per paper can be built for the author, Table 3 (Author, Citations, Papers, Citations/Papers).
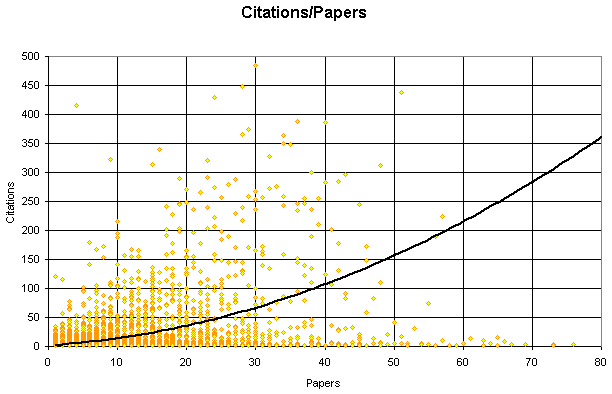
Graph of the number of citations an author has received, against the number of papers that author has written. A trend (Excel: poly 2) is shown in black.
Excluding Self-Citation
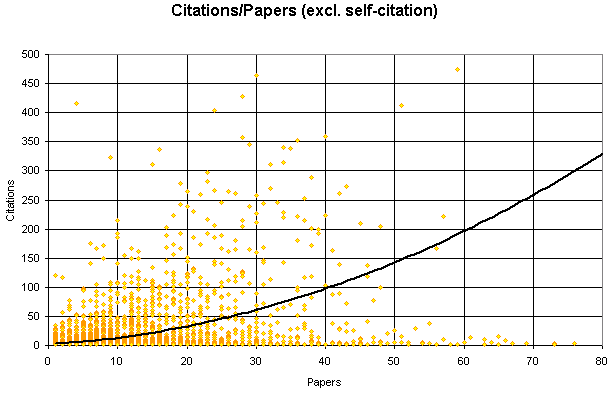
Using the same technique as above the citation "impact" can be found for authors, except excluding any occasions where an author references themselves.
Source Paper - Cited Paper
AuthorsA - AuthorsB
...do not give a citation to author B if that author is in set A
This results in Table 4.
(Code to generate mean citations/author awk '{print $1"\t"$2"\t"$3"\t"($2/$3)}' < d_notauthorcitations2 | sort -rn +3 > d_notauthorcitations3)
Defining Impact
(Tim's patent-pending bear-no-relationship-to-statistics-method)
Using Table 4, where $2 is the sum citations (y axis) and $3 is the sum papers (x axis).
| Impact | Total | Cit's | Papers | Shell Script |
|---|---|---|---|---|
| High | 338 | 61294 | 8411 | awk '{ if( $2 >= 50 && $3 >= 10 ) print $0 }' < d_authorcitations3 > d_highimpact |
| Medium | 2756 | 30009 | 28926 | awk '{ if( ($2 < 50 || $3 < 10) && $2 > 1 && $3 > 1 ) print $0 }' < d_authorcitations3 > d_medimpact |
| Low | 2215 | 3615 | 12269 | awk '{ if( ($2 < 50 || $3 < 10) && ($2 == 1 || $3 == 1)) print $0 }' < d_authorcitations3 > d_lowimpact |
Although some highly-cited authors may be excluded from "High Impact", because I require a minimum number of papers. It is assumed that an author's lack of articles shows that they either do not use the archive or have not written many papers, in which case their impact may be a "one off".
Splitting By Thirds
Using the citations/papers ratio as sort algorithm, then splitting the authors into three equal groups.
| Third | Citations | Papers |
|---|---|---|
| Top | 84654 | 16169 |
| Middle | 7113 | 11020 |
| Bottom | 3151 | 22417 |
Splitting Using Quartiles
Using the citations/papers ratio as cumulator for quartiles. Taking top/bottom 25% and middle 50%.
Adding in the number of deposits that the articles that these authors have deposited have, and taking the mean over the number of authors. Dividing this by the mean number of papers per author generates a deposit "rate" for the sector - the mean number of deposits per paper per author.
| Quartile | Total | Citations | Papers | Deposits | (Deposit Authors) | Deposits/Author | Papers/Author | Deposit Rate |
|---|---|---|---|---|---|---|---|---|
| Top | 125 | 29011 | 1649 | 2787 | 123 | 22.6585 | 13.192 | 1.718 |
| Middle | 1119 | 49536 | 10279 | 15613 | 1068 | 14.6189 | 9.186 | 1.591 |
| Bottom | 4066 | 16371 | 37678 | 47809 | 3849 | 12.4211 | 9.267 | 1.340 |
| Quartile | Citation Impact (Cites/Papers/Authors) |
Hits Impact (all areas) (Hits/Papers/Authors) |
|---|---|---|
| Top | 0.141 | 11.873 |
| Middle | 0.00431 | 8.185 |
| Bottom | 0.000107 | 5.085 |
| (Unranked) | 4.280 |
Authors Per Paper
Total number of papers are the number of abstracts, that are after
1995 - we can't get authors before that time:
grep hep-th < q1/d_papers | grep abs | restrictcol
'-3/(1991)|(1992)|(1993)|(1994)/' | wc
Total number of authors:
grep hep-th < d_authors | awk '{ print $1 }' | sort | uniq | wc
| Area | Papers | Authors | Authors/Papers |
|---|---|---|---|
| hep-th | 14534 | 7036 | 0.484 |
| hep-ph | 19374 | 8266 | 0.427 |
| cond-mat | 20521 | 15425 | 0.752 |
| astro-ph | 20629 | 14027 | 0.680 |
| math | 7200 | 5255 | 0.730 |
Authors per Paper, by Impact
Using the impact level author list, a list of papers by those authors can be compiled. Using that list of papers a list of authors who are named for those papers can be built.
| Authors/Paper | 1 | 2 | 3 | 4 | 5 | 6 | 7 | 8 | 9 | 10 |
|---|---|---|---|---|---|---|---|---|---|---|
| High Impact | 383 | 458 | 240 | 135 | 27 | 9 | 1 | 1 | 0 | 1 |
| Medium Impact | 2024 | 2332 | 1526 | 608 | 128 | 46 | 12 | 3 | 1 | 5 |
| Low Impact | 8403 | 7695 | 5174 | 2132 | 689 | 259 | 127 | 67 | 45 | 44 |
Paper state by Author Impact
The state of papers, by author impact level.
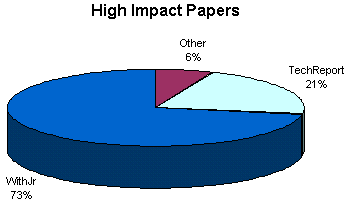
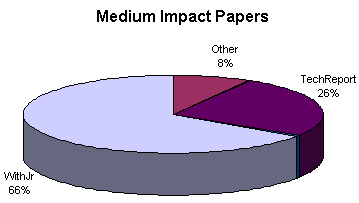
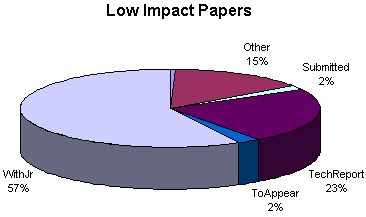
For Whole Archive
Using spotcites data for all papers.
What proportion of citations does this cover?
| wc SCOOT.OUT | wc d_papers | Total Citations | Total "Red Link"/"Orange Link" Citations | Antique |
|---|---|---|---|---|
| 3,090,131 | 132219 | 2,957,912 | 603,460 | 836,945 |
This gives 100*(603460/2957912) = 20.40% (i.e. 1 in 5 citations), as a proportion of all citations in the archive. (603460/132219) = 4.56 citations/paper identified, against 2957912/132219 = 22.37 citations/paper identified from PDF source.
Analysing how many red/orange links have been picked up, by year. Using the raw citation data (paper -> citation), the number of references for a given year can be found by taking the first two digits from the paper reference. The total number of papers deposited in that year can then be found by using a listing of all papers in the archive and using the first two digits of the paper references. When taking the total number of papers, any papers from areas that did not have any references were ignored.
Total citations = 597688. Total papers = 115940 (only includes 2000 up to June).
| Year | Papers Deposited | Citations | Citations/Paper |
|---|---|---|---|
| 91 | 305 | 19 | 0.0623 |
| 92 | 2,891 | 1,291 | 0.447 |
| 93 | 6,127 | 7,576 | 1.24 |
| 94 | 8,901 | 19,171 | 2.15 |
| 95 | 11,034 | 39,240 | 3.56 |
| 96 | 13,709 | 61,019 | 4.45 |
| 97 | 17,310 | 100,714 | 5.82 |
| 98 | 21,040 | 132,096 | 6.28 |
| 99 | 24,163 | 142,888 | 5.91 |
| 00 | 10,460 | 93,674 | 8.96 |
Using quartiles we come up with the following split for authors:
| Quartile | Total | Citations | Papers | Cites/Author/Paper | Deposits | Mean Deposits/Author | Variance |
|---|---|---|---|---|---|---|---|
| Top | 798 | 240,092 | 2,732 | 0.110 | 6,720 | 1.47526 | 0.301527 |
| Middle | 9,262 | 733,272 | 37,318 | 0.00212 | 93,671 | 1.36982 | 0.218753 |
| Bottom | 28,211 | 251,925 | 67,951 | 0.000131 | 165,971 | 1.2665 | 0.189012 |
Mean number of citations/author (ignoring the number of papers those authors have deposited).
| Quartile | Total | Sum Citations | Mean | Variance |
|---|---|---|---|---|
| Top | 798 | 240092 | 300.867 | 1213.259 |
| Middle | 9262 | 733272 | 79.170 | 203.716 |
| Low | 28211 | 251925 | 8.930 | 30.281 |
Mean number of hits/paper (by author impact).
| Impact | Total | Sum Hits | Mean | Variance |
|---|---|---|---|---|
| High | 2732 | 22674 | 8.299 | 232.487 |
| Medium | 37318 | 144714 | 3.878 | 71.434 |
| Low | 67951 | 195867 | 2.882 | 37.584 |
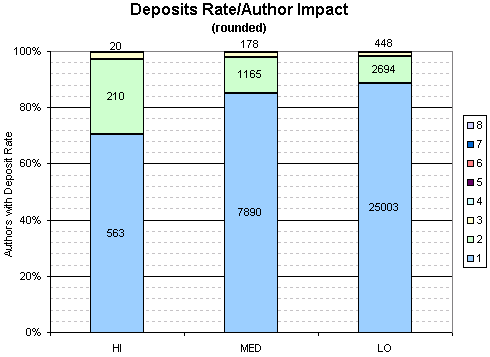
This graph shows the proportion of authors with a given deposit rate for different impact levels. The number of authors for each deposit rate is shown.
Papers that have authors from different impact levels/% of all unique papers in combined area:
| High | Medium | Low | |
|---|---|---|---|
| High | - | 1586/4.12% | 254/0.361% |
| Medium | 1586/4.12% | - | 12881/13.9% |
| Low | 254/0.361% | 12881/13.9% | - |
Papers with authors from all three impact levels: 155/ (155/93435) 0.166%
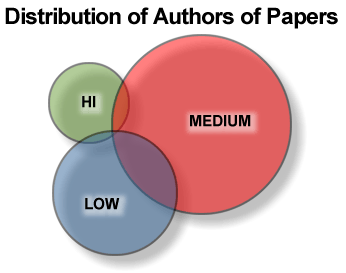
This diagram shows the approximate authorship of papers (the area of all the circles are all the papers, and each circle represents the authors of those papers). Therefore where the circles intercect is where papers have authors from more than one impact level.
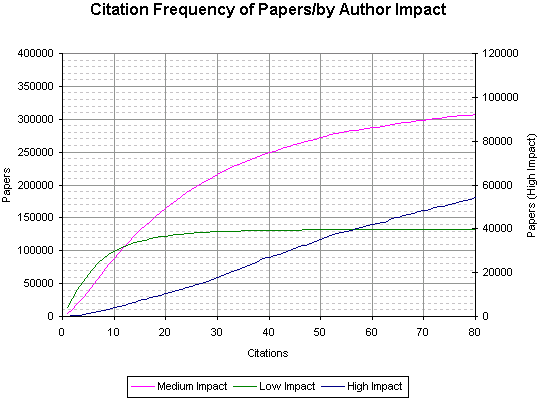
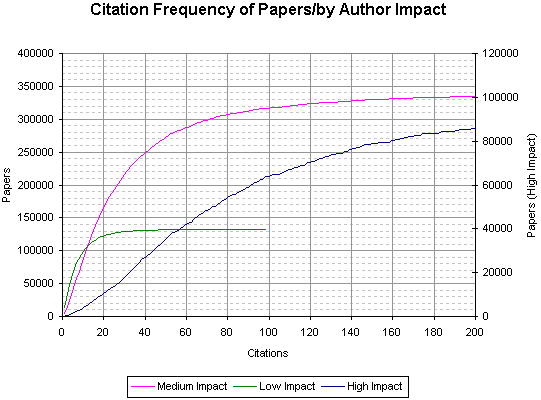
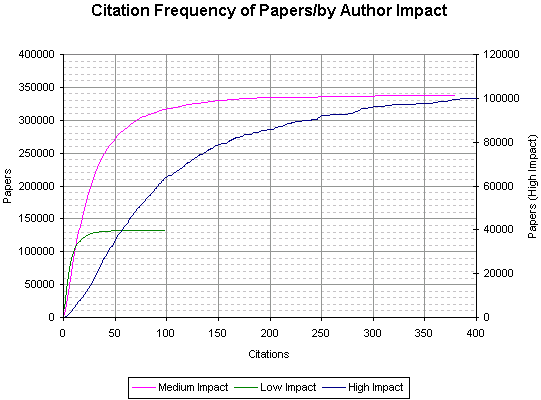
This graph shows the cumulative number of papers against the number of citations for those papers (divided into high, med, low impact authors).
Authors per paper (awk '{ print $2 }' d_highimpactauthorpapers | sort | uniq -c | awk '{ c++; s += $1 } END { print s/c }'):
| Level | Mean | Variance |
|---|---|---|
| High | 1.56442 | 7.50354 |
| Med | 1.81082 | 4.52046 |
| Low | 1.94748 | 4.31381 |
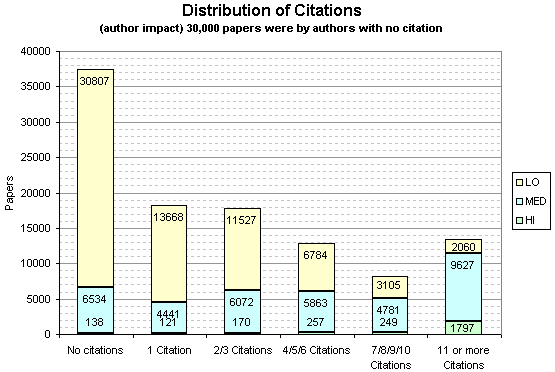
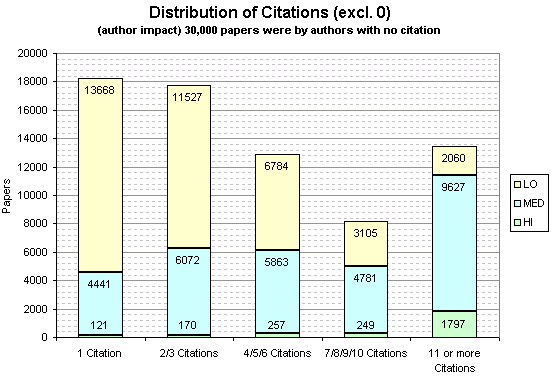
These graphs show the frequency of papers broken down by the number of citations they receive and by what impact the authors were (so these graphs may feature the same paper more than once, as a individual paper may have more than one author).
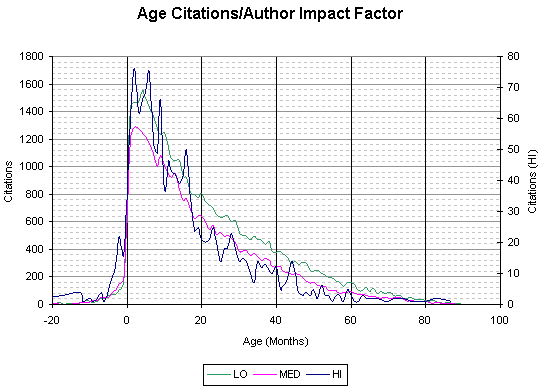
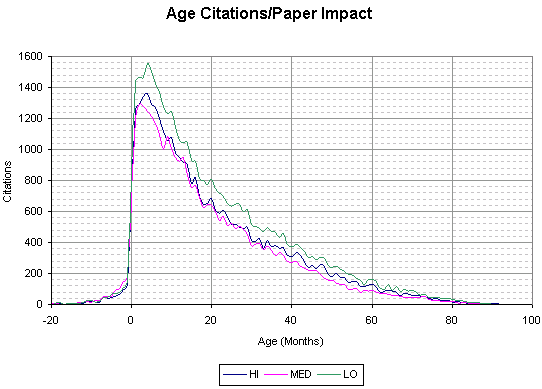
This graph shows the age of citations (the time difference between a paper being deposited and its referenced papers being deposited), broken down by the impact factor of the paper's authors.
How long have authors been depositing?
Using the authored list (paper ref * author name), the time difference in months can be found between the first paper the author deposited and the last. This includes authors who have only one paper in the archive (defined as have a period of 0 months).
| Total Authors | Mean Timediff(months) | Variance(months) |
|---|---|---|
| 75062 | 13.824 | 431.147 |
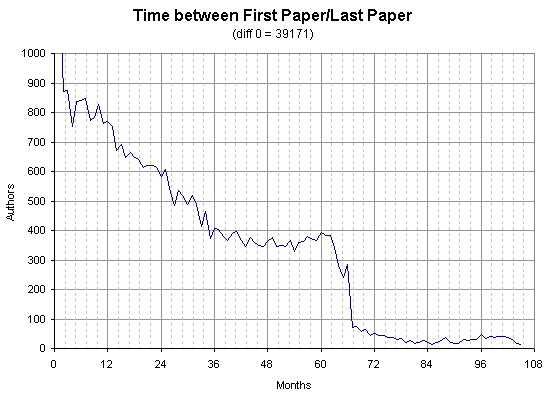
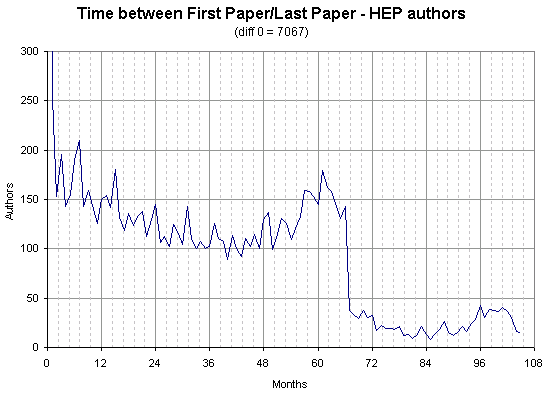
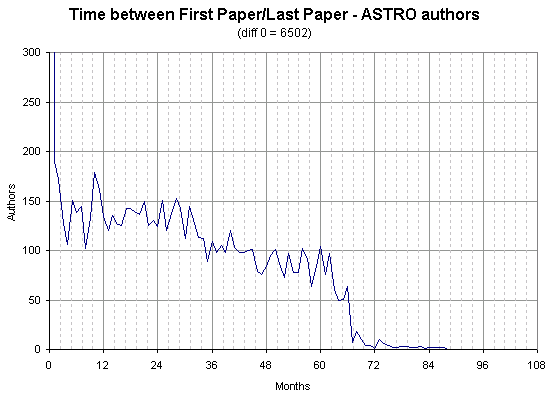
Author names can not be easily extract pre-1994, so there is a peak at 5 years of usage from all the authors who have continually deposited from before that period, but only appear in 1995.
Looking at the time between every paper deposited by an author:
| Total 2+ Papers | Mean Timediff(months) | Variance(months) |
|---|---|---|
| 153418 | 6.764 | 62.150 |
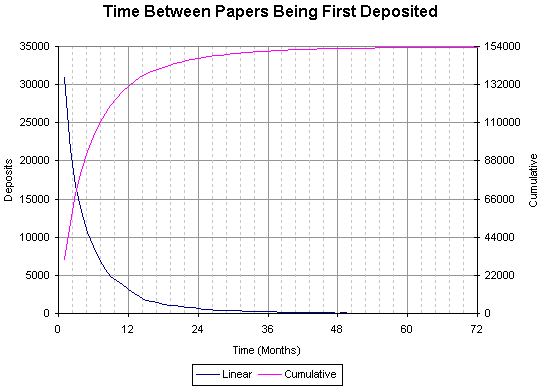
This graph is based on taking the time difference, in order, between papers deposited by authors (the yymm part of the paper reference), excluding the time difference between two papers deposited in the same month (i.e. 0).
Growth of Authors Over Time
By using the meta data "author" field, the number of unique authors of papers per year can be found (for most areas the number of authors can not be easily found at or before 1994).
| Year | Authors |
|---|---|
| 1991 | 411 |
| 1992 | 1152 |
| 1993 | 1439 |
| 1994 | 5958 |
| 1995 | 15198 |
| 1996 | 17762 |
| 1997 | 22359 |
| 1998 | 27785 |
| 1999 | 32673 |
| 2000-06 | 19593 |
Analysing number of authors by LANL subfield
Using the authors meta-data field the author list can be found for each paper. The total number of authors and total number of papers can then be found by summing each occurence of a unique author for each area and each occurence of a unique paper for each area. To find the variance the number of authors per paper was also stored.
Because the authors meta-data field did not exist in some areas before 1995 all these years have been ignored.
| Area | Authors | Papers | Authors/Papers | Standard Deviation |
| acc-phys | 114 | 43 | 2.651 | 8.828 |
| adap-org | 305 | 245 | 1.245 | 1.219 |
| alg-geom | 649 | 854 | 0.760 | 1.059 |
| ao-sci | 19 | 13 | 1.462 | 0.761 |
| astro-ph | 12754 | 17509 | 0.728 | 4.244 |
| atom-ph | 112 | 68 | 1.647 | 1.258 |
| bayes-an | 8 | 11 | 0.727 | 0.273 |
| chao-dyn | 1391 | 1416 | 0.982 | 1.733 |
| chem-ph | 143 | 89 | 1.607 | 1.551 |
| cmp-lg | 641 | 671 | 0.955 | 1.326 |
| comp-gas | 119 | 78 | 1.526 | 1.357 |
| cond-mat | 13766 | 17411 | 0.791 | 2.272 |
| cs | 915 | 661 | 1.384 | 1.960 |
| dg-ga | 398 | 501 | 0.794 | 1.025 |
| funct-an | 169 | 213 | 0.793 | 0.895 |
| gr-qc | 2959 | 5098 | 0.580 | 2.202 |
| hep-ex | 2493 | 1689 | 1.476 | 7.065 |
| hep-lat | 1299 | 2517 | 0.516 | 3.438 |
| hep-ph | 7597 | 16875 | 0.450 | 2.635 |
| hep-th | 5987 | 12788 | 0.468 | 1.769 |
| math | 3808 | 5324 | 0.715 | 1.131 |
| math-ph | 781 | 705 | 1.108 | 1.090 |
| mtrl-th | 213 | 148 | 1.439 | 1.765 |
| neuro-dev | 2 | 1 | 2.000 | 0.000 |
| neuro-sys | 33 | 13 | 2.538 | 1.321 |
| nlin | 530 | 303 | 1.749 | 1.365 |
| nucl-ex | 2141 | 432 | 4.956 | 13.016 |
| nucl-th | 2906 | 4078 | 0.713 | 2.490 |
| patt-sol | 435 | 351 | 1.239 | 1.572 |
| phys-lib | 3 | 2 | 1.500 | 0.500 |
| physics | 2966 | 2051 | 1.446 | 2.459 |
| plasm-ph | 48 | 28 | 1.714 | 1.321 |
| q-alg | 773 | 1161 | 0.666 | 1.457 |
| quant-ph | 2789 | 3975 | 0.702 | 1.782 |
| solv-int | 582 | 747 | 0.779 | 1.335 |
| supr-con | 137 | 64 | 2.141 | 2.097 |
We can also analyse the distribution of authors between archive sub-fields by finding the intersection and union between sets of authors from different fields. The values shown is the cardinality of intersection divided by cardinality of union.