Citation Analysis
Last updated August 31 2000 16:28:28.
This data is based on extracting citations to documents in the arXiv archive from documents deposited in the hep-th area, between 1998 and 2000.
The citations were extracted using Spotcites by Dr. Les Carr. The output was then formatted into a tuple table containing the document analysed and its citations of arXiv documents (see Table 1).
hep-th/0004201 hep-th/9906194
hep-th/0004201 hep-th/9908116
hep-th/0004201 hep-th/9909041
hep-th/0004201 hep-th/9909121
hep-th/0004201 hep-th/9912132
hep-th/0004201 hep-th/9807137
hep-th/0004201 hep-th/0001065
hep-th/0004201 hep-th/9903214
hep-th/0004201 hep-th/9612229
hep-th/0004201 hep-th/9901056
Table 1 |
Using the inferred date of submission in the arXiv reference (______/yymm___), a month difference can be found between the initial deposit of the article and its citations. This data set can then be summed together to obtain a list of month differences and the number of citations that fall in that time difference (see Table 2).
Some anomolies can be seen in Table 2, most obviously that authors are citing documents "in the future"
(negative month difference).
This can be explained by authors updating documents after initial deposition and referencing articles that
have been newly deposited. The total number of future citations is 272 (of a total 47045 citations).
The citation tuples (see Table 1) can be used to build a table of the number of citations to documents (the second column), as cited by papers in hep-th.
Using Unix shell script:
awk '{print $2}' < cited/ZZZ | sort | uniq -c | awk '{print $1"\t"$2}' | sort -rn > d_cited
a tuple set of number of citations against paper reference can be built (see Table
3). Note that this data set is not restricted to hep-th, as articles may cite outside of their own
area.
This data can then be cross-referenced with the paper state information that can be obtained from the paper abstract (see Table 4).
The types of citation can then be summed together to determine the type of citations that were made:
awk '{c = $1; while($1--) print $3}' < d_citedstate | sort | uniq -c
333
32 Accepted
3265 Other
3 Review
140 Submitted
9732 TechReport
27 Thesis
204 ToAppear
33313   WithJr
Table 5 |
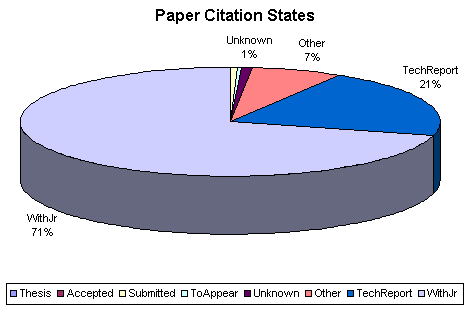
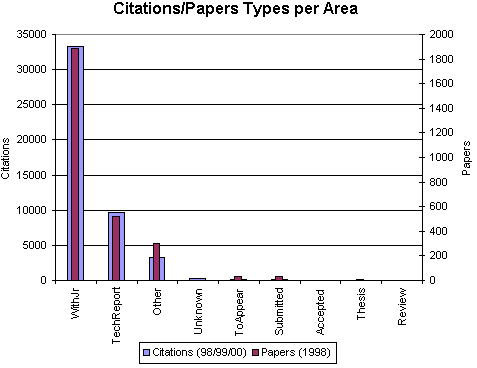
This graph shows the citation state distribution against the state distribution of papers first deposited in 1998.
What do different states of article cite the most?
Using the original data set (see Table 1) we can obtain the state of the analysed article and of its citations. We can break the results down by the state of the analysed article, and sum together the state of the cited articles.
For Technical Reports:17 Accepted 1361 Other 2 Review 49 Submitted 5019 TechReport 15 Thesis 78 ToAppear 11210 WithJrFor articles with a Journal Refernece (WithJr): 6 Accepted 872 Other 48 Submitted 2717 TechReport 6 Thesis 66 ToAppear 18003 WithJrTable 6 |
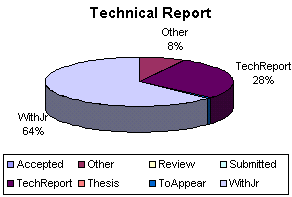
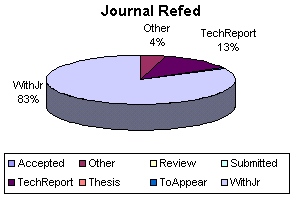
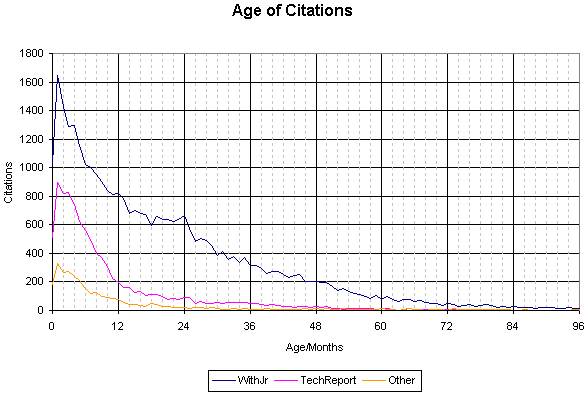
How does the age of citations vary with the state of the cited article?
Using the data from table 1, and adding the state of the cited article, a similar table to table 2 can be built for different states; with a journal ref, technical reports and "other" (papers that have no recognisable state). This can then be ploted to compare different rates of citation of the relative age of articles.
Using the data from table 1 a distribution of where citations are can be built, by summing together the area that the citation reference points to. This only includes citations to other areas in arXiv.
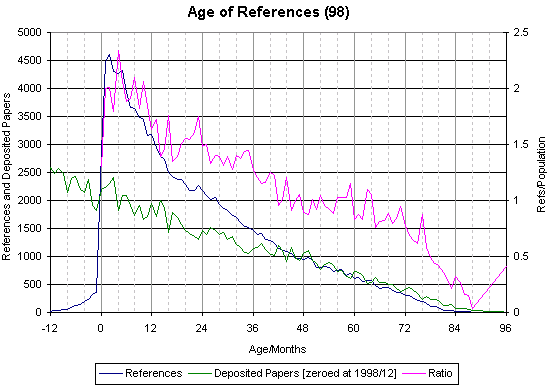
Taking papers deposited in 1998 and finding the time difference, in months, between the date each paper was deposited and the date that papers it references were deposited. Comparing this to the number of papers that were deposited in the month of the referenced paper (taking 1998/12 as month 0). The ratio is the number of referenced papers divided by the number of papers deposited in that month.
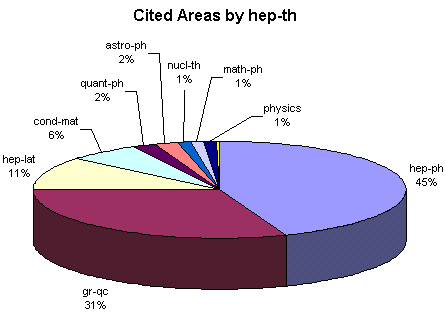
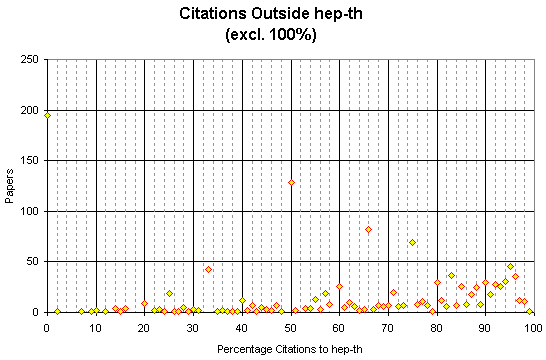
A distribution of where papers cites can be built by taking the percentage of citations for each paper that do not refer to hep-th. See Table 5.
Table of papers that have 0% of citations within hep-th:
| Citations | Papers |
|---|---|
| 1 | 118 |
| 2 | 37 |
| 3 | 24 |
| 4 | 5 |
| 5 | 6 |
| 7 | 1 |
| 9 | 3 |
| 14 | 1 |
Age of Citations
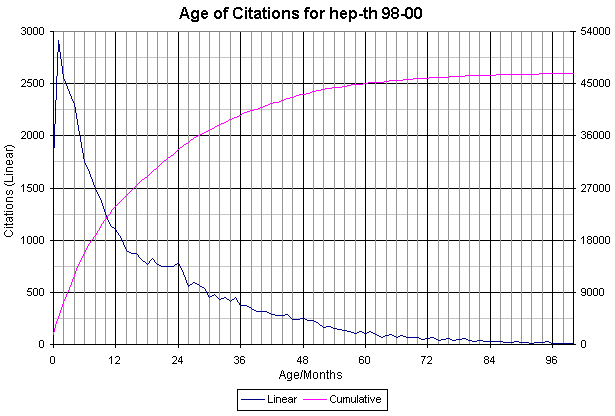
It appears that the age of citations within hep-th is very young (with a peak number of citations being just 1 month difference between the deposit of the cited paper and the deposit of the paper).
To take an example, Theta Dependence In The Large N Limit Of
Four-Dimensional Gauge Theories, by Edward Witten (hep-th/9807109).
This has the following citations to it (from hep-th, between 1998-00):
hep-th/9802095 hep-th/9807109 -5
hep-th/9807140 hep-th/9807109 0
hep-th/9807156 hep-th/9807109 0
hep-th/9809033 hep-th/9807109 2
hep-th/9809106 hep-th/9807109 2
hep-th/9809173 hep-th/9807109 2
hep-th/9809184 hep-th/9807109 2
hep-th/9810186 hep-th/9807109 3
hep-th/9908148 hep-th/9807109 13
hep-th/9910229 hep-th/9807109 15
The month difference is shown in the third column.
By searching Web of Science, we can find the citations to this article by all papers. This gives us a total of 22 citations. The publication date of the article is stated as 5th October 1998. We can then read off the dates of citing articles:
Jun 2000 - 20
Jun 2000 - 20
Jun 2000 - 20
Apr 2000 - 18
Dec 1999 - 14
Feb 2000 - 16
Jan 2000 - 15
Nov 1999 - 13
Jan 2000 - 15
Dec 1999 - 14
Sep 1999 - 11
Sep 1999 - 11
Aug 1999 - 10
Aug 1999 - 10
Jul 1999 - 9
Jul 1999 - 9
May 1999 - 7
Apr 1999 - 6
Apr 1999 - 6
Mar 1999 - 5
Jan 1999 - 3
This behaviour could be explained because arXiv stores mostly preprints, therefore once the paper goes into print it will be referenced there rather than in the archive (therefore there will be few "old" citations). However the high number of citations that occur soon after the paper being deposited suggests that authors are citing new work soon after it has been released. This can not happen, or is greatly reduced, in the peer-reviewed print world, when publication can take upwards of 6 months/year.
Influence of profile shape on the diocotron instability in a non-neutral plasma column, R.C. Davidson, G.M. Felice. Published in October 1998.
Date of citations to this article (5 total):
May 2000 - 19
Apr 2000 - 18
Mar 2000 - 17
Oct 1999 - 12
Sep 1999 - 11
Open inflation, the four form and the cosmological constant, Turok N, Hawking SW. Published in July 1998.
Date of citations to this article (14 total):
2000 - 24
Jan 2000 - 18
Dec 1999 - 17
Nov 1999 - 16
Apr 1999 - 9
Sep 1999 - 14
Aug 1999 - 13
Jul 1999 - 12
Feb 1999 - 7
Apr 1999 - 9
Mar 1999 - 8
Jan 1999 - 6
Jan 1999 - 6
Dec 1998 - 5
Range of Citations within Impact Factor
Using papers by author impact factor. Self citations are based on joining together a unique list of papers from that impact level against the citations from papers of that impact level (so there may be more than one citation to an individual paper).
| Impact Factor | Citations | Self-Citations | Self/Citations |
|---|---|---|---|
| High | 7269 | 4302 | 59% |
| Medium | 32141 | 20973 | 65% |
| Low | 17727 | 6700 | 38% |
So low impact authors are less likely to cite other low impact authors, compared to citing high or medium impact authors.
Using All Archive Papers
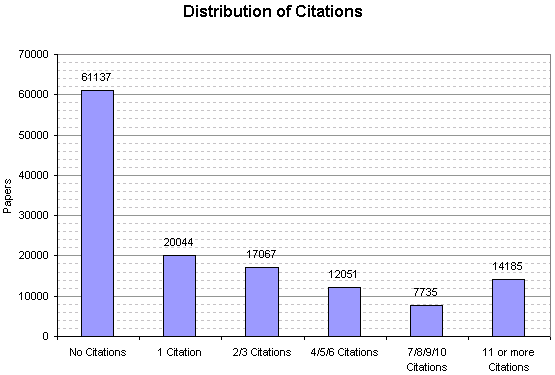
Total number of articles that received a citation: 71297, of 132219 total papers (53.92%).
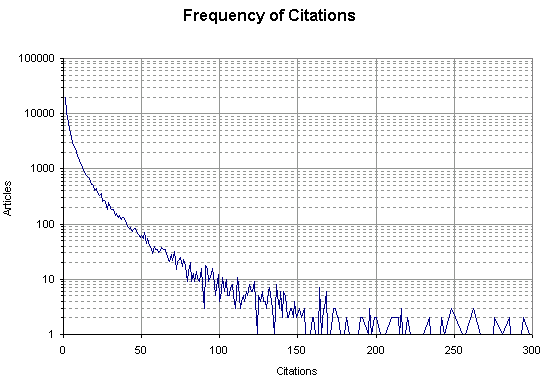
Graph of the frequency of citations (number of articles/citations per article).
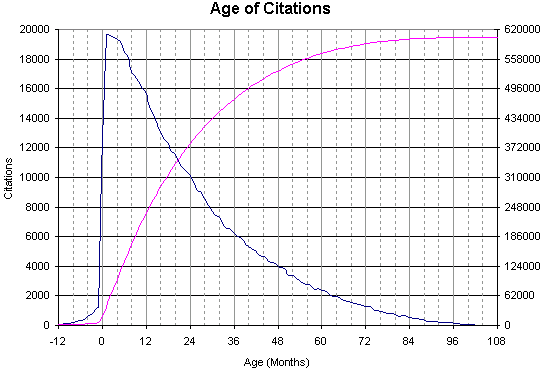
Analysing the age of citations (cumulative is shown in pink).
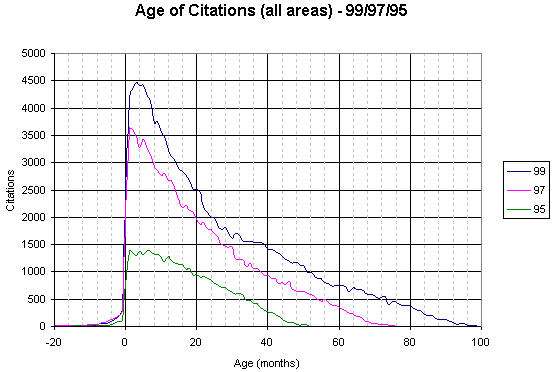
This graph breaks down the citation ages by papers deposited in '99,'97 and '95.
Citations to Papers Deposited in 1998
Analysing citations to papers that were deposited in 1998 (i.e. citations from 1998, 1999 and 2000). Therefore this data covers citations with a latency of up to 2 years.
grep '/98' d_cited | sort | awk '{ print $1 }' | uniq | wcgrep '/98' ../q1/d_papers | grep abs | wc
Total number of articles that received a citation: 13450, of 24057 total papers (55.91%).
Frequency of citations (no. citations * no. articles). See table 7.
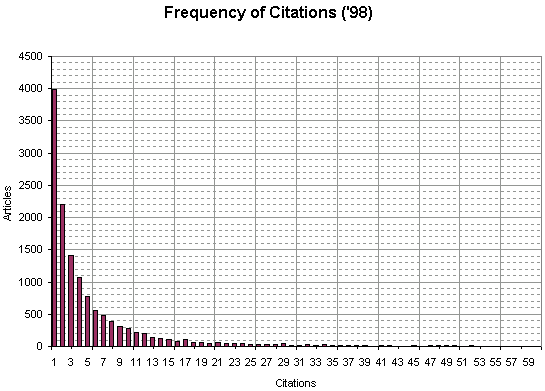
X axis scale has been restricted (max citations is 768).
Total citations/Total papers = 89774/24057 = 3.73 (based on Red/Orange links).
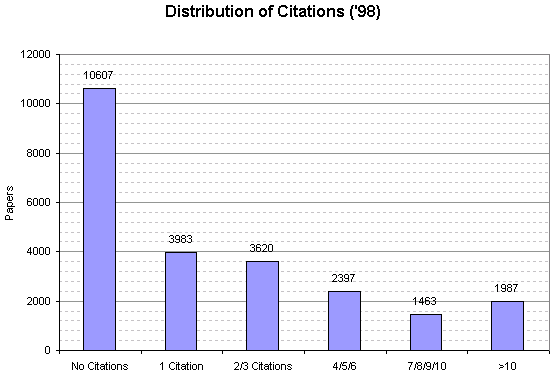
| Papers with | |||||
|---|---|---|---|---|---|
| No Citations | 1 Citation | 2/3 Citations | 4/5/6 | 7/8/9/10 | >10 |
| 10,607 | 3,983 | 3620 | 2397 | 1463 | 1987 |

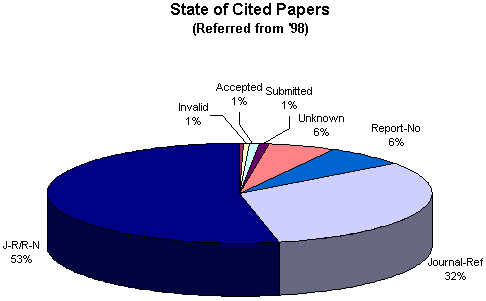
Analysing the state of papers referenced in 1998
Looking at the citations from papers deposited in 1998.
For all papers:
| Type | Number |
|---|---|
| Thesis | 83 |
| Review | 201 |
| Invalid | 730 |
| Accepted | 1036 |
| Submitted | 1426 |
| Unknown | 7339 |
| Report-No | 8506 |
| Journal-Ref | 42467 |
| J-R and R-N | 70308 |
