Impact Assessment
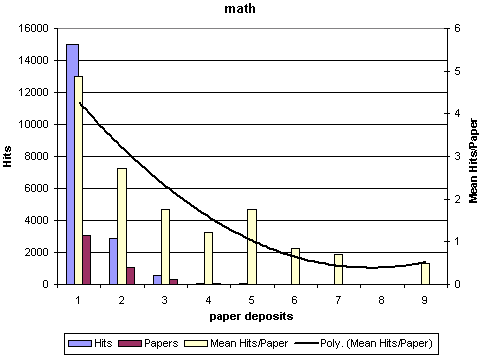
The following graphs plots the hits/no of papers against the number of deposits for those papers. This demonstrates there is a approximate linear relationship between how many times a paper is deposited to the number of hits it receives (how many times someone looks at it).
This is based on the period between August 1999 to May 2000.
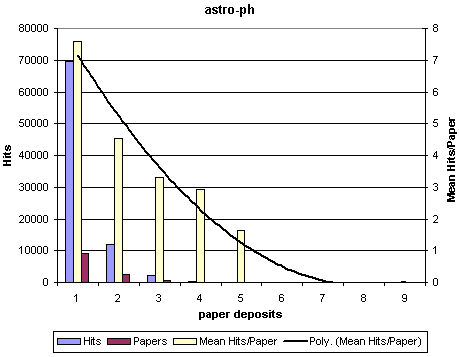
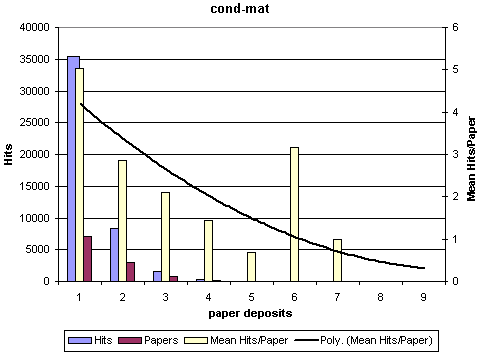
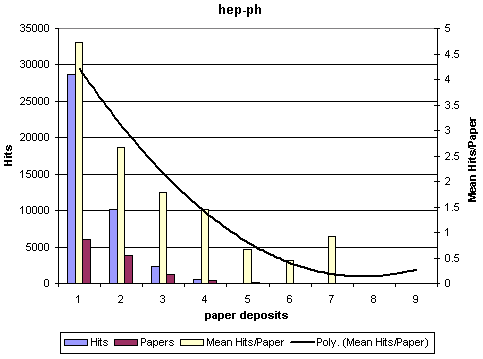
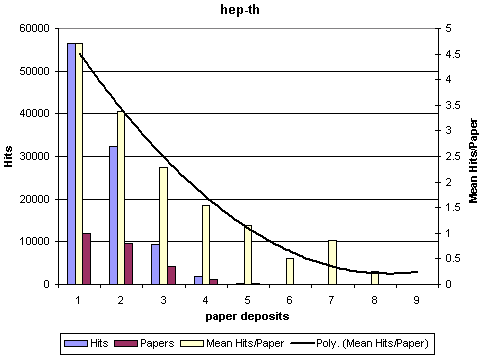
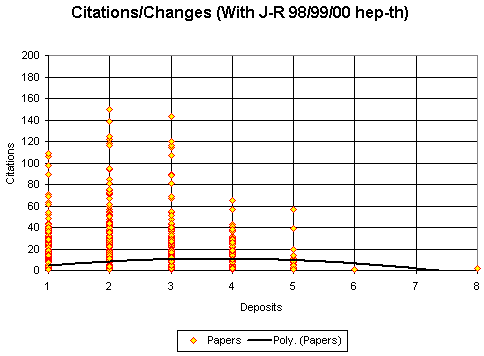
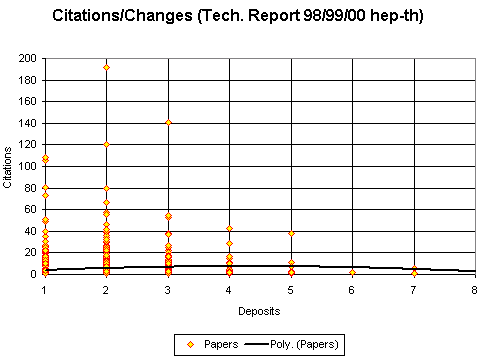
Analysing citations against changes (for which data between 1998/1999/2000 in the hep-th area is available), a graph can be plotted of the number of deposits for a paper against the number of citations that paper has received.
Mean and variance of hits per paper, for all areas.
| Deposits | Total Hits | Total Papers | Mean Hits/Paper | Variance |
|---|---|---|---|---|
| 1 | 261389 | 47428 | 5.11 | 60.502 |
| 2 | 81818 | 12409 | 6.59 | 102.96 |
| 3 | 19895 | 2899 | 6.86 | 150.527 |
| 4 | 3901 | 594 | 6.567 | 73.791 |
| 5 | 805 | 136 | 5.919 | 51.971 |
| 6 | 234 | 31 | 7.548 | 127.409 |
| 7 | 72 | 13 | 5.692 | 7.44 |
| 8 | 2 | 1 | 2 | 0 |
| 9 | 9 | 2 | 4.5 | 6.25 |
| 10 | 19 | 3 | 6.333 | 14.222 |
| 11 | 2 | 1 | 2 | 0 |
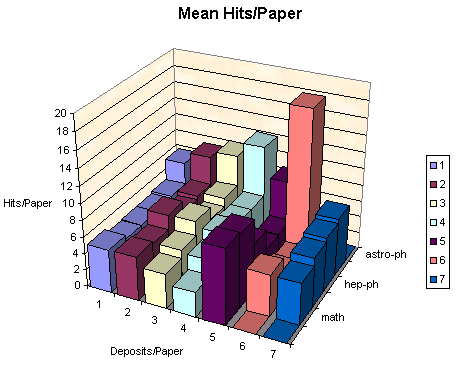
Areas are:
astro-ph cond-mat hep-ph hep-th math physics