![]() Top
Top
![]() Abstract
Abstract
![]() Materials and Methods
Materials and Methods
![]() Results
Results
![]() Discussion
Discussion
![]() References
References
|
|
|---|
( electroencephalogram / electrocorticogram / direct cortical recording / cooperativity of neurons)
T.H. Bullock, M.C. McClune, J.Z. Achimowicz§, V.J. Iragui-Madoz, R.B. Duckrow† and S.S. Spencer*
Department of Neurosciences, University of California, San Diego, La Jolla, CA 92093-0201
§ Department of CNS Diagnostics, Polish Air Force Institute of Aviation Medicine, Warsaw, Poland
† Department of Neurology, University of Connecticut Health Center, Farmington, CT 06030
* Department of Neurology, Yale University School of Medicine, New Haven, CT 06510
Contributed by Theodore H. Bullock, ............. 1995
Correspondence:
T.H. Bullock
Department of Neurosciences,
University of California, San Diego,
La Jolla, CA 92093-0201
Tel. (619) 534-3636. Fax: (619) 534-3919;
E-mail: tbullock@ucsd.edu
|
|
Abstract |
|
|
|---|
As a measure of dynamical structure, short term fluctuations of coherencebetween 0.3 and 100 Hz in the electroencephalogram (EEG) of humans were studied from recordings made by chronic subdural macroelectrodes 5-10 mm apart, on temporal, frontal and parietal lobes, and from intracranial probes deep in the temporal lobe, including the hippocampus, during sleep, alert and seizure states. The time series of coherence between adjacent sites calculated every second or less often varies widely in stability over time; sometimes it is stable for half a minute or more. Within two minute samples, coherence commonly fluctuates by a factor up to 2 or 3, in all bands, within the time scale of seconds to tens of seconds. The power spectrum of the time series of these fluctuations is broad, extending to 0.02 Hz or slower, and is weighted toward the slower frequencies; little power is faster than 0.5 Hz. Some records show conspicuous swings with a preferred duration of 5-15 s, either irregularly or quasi-rhythmically with a broad peak around 0.1 Hz. Periodicity is not statistically significant in most records. We have not found a consistent difference between lobes of the brain, subdural and depth electrodes or sleeping and waking states, in our sampling. Seizures generally raise the mean coherence in all frequencies and may reduce the fluctuations by a ceiling effect. The coherence time series of different bands is positively correlated (0.45 overall); significant non-independence extends for at least two octaves. Coherence fluctuations are quite local; the time series of adjacent electrodes is correlated with that of the nearest neighbor pairs (10 mm) to a coefficient averaging ca. 0.4, falling to ca. 0.2 for neighbors-but-one (20 mm) and to < 0.1 for neighbors-but-two (30 mm).
The evidence indicates fine structure in time and space, a dynamic and local determination of this measure of cooperativity. Widely separated frequencies tending to fluctuate together exclude independent oscillators as the general or usual basis of the EEG, although a few rhythms are well known under special conditions. Broadband events may be the more usual generators. Loci only a few mm apart can fluctuate widely in seconds, either in parallel or independently. Scalp EEG coherence cannot be predicted from subdural or deep recordings, or vice versa and intracortical microelectrodes show still greater coherence fluctuation in space and time 1. Widely used computations of chaos and dimensionality, made upon data from scalp or even subdural or depth electrodes, even when reproducible in successive samples, cannot be considered representative of the brain or the given structure or brain state but only of the scale or view (receptive field) of the electrodes used. Relevant to the evolution of more complex brains, which is an outstanding fact of animal evolution, we believe measures of cooperativity are likely to be among the dynamic features by which major evolutionary grades of brains differ.
In spite of a large literature on the electroencephalogram, we have an extremely limited picture of the structure of activity in the brain on the scales of millimeters and seconds. In spite of a prevailing view that the principal generators of the compound field potentials in the brain are microscopic, cellular or subcellular and chiefly membrane potentials, our extant data base is mainly scalp recordings on humans, usually 40 mm apart, each conservatively estimated to take the vector sum of activity in ca. 15 million cells, assuming a volume 1.5 mm deep x 10 x 10 mm tangentially at 50,000 neurons per cubic millimeter and an equal number of glia. In spite of an extensive knowledge of cellular interaction by synaptic mechanisms, our quantitative understanding of the amount of interaction by this route versus electrotonic or chemical field effects is almost nil. Under such circumstances, we consider quite vulnerable such concepts as synchronization, resonance, rhythmicity and independence of frequency components of the EEG - each an inference, but seldom measured.
The present report is one of a series aiming at some insight into the fine structure in space and time of the dynamical signs provided in the compound field potentials, as recorded directly on or in the brain 1, 2, 3, 4, 5, 6, 7, 8, 9. The main goal is to test the hypothesis that one measure of cooperativity at each frequency, namely coherence, varies in time on the scale of seconds or fractions of a second, with evidence of more than stochastic structure and that the fluctuation is different for closely spaced loci. We will show in addition that a wide range of frequency components of the EEG tend to covary in coherence, contrary to the usual assumption of independent oscillators.
|
|
Materials and Methods |
|
|
|---|
Subdural EEG recordings from 4 patients were supplied by V.J.I-M. from the U.C.S.D. Epilepsy Center. Neurosurgeon J.F. Alksne had implanted plastic subdural strips bilaterally on frontal, temporal and parietal lobes, each strip carrying a row of eight electrodes at 10 mm intervals, for long term recording for localization of seizure foci. We took 2-4 min samples of EEG during slow wave (stage 2-3) sleep, during alert interictal periods and during electrical seizures. Some samples were taken in the operating room when the patient was sedated (nitrous oxide, Fentanyl and Forane) but awake, able to respond to commands and questions, because recording arrays with 5 mm spacing were used.
Depth recordings from 3 patients were made available by S.S.S. and R.B.D. from the Yale University Epilepsy Surgery Program. Neurosurgeon D.D. Spencer had implanted depth electrode arrays with 12 or 14 electrode contacts in both medial temporal lobes. They were placed under MRI control in the parasagittal planes such that electrodes #1-3 were, in a certain subject, in the amygdala, 3-5 in the pes and mid-body of the hippocampus, 5-7 in posterior hippocampus and more posterior ones in the occipital lobe, with an estimated variation between subjects of up to two contacts. A diagram of the placement is given by Duckrow and Spencer 10. (Additional subdural channels sampled overlying temporal cortex of the superior, middle or inferior gyrus or fusiform gyrus or entorhinal cortex of one or both sides, but were used here only in sample pairings with depth loci.) The actual electrode contacts in the subdural surface strips with 10 mm spacing are 2 mm metal disks, slightly smaller in the grids with 5 mm spacing. The contacts on the temporal lobe depth arrays are nichrome collars 2 mm long x 1mm in diameter around a polyurethane tube; they are spaced either 6.5 mm (in subject C) or 9 mm (subjects H & W), center to center.
Monopolar recording was selected, with a common extracranial reference, for the subdural recordings usually on linked ears, for the depth records either on one mastoid process or one ear. (For a discussion of this choice over bipolar recording, see 9). In view of the warnings in the literature that coherence with a common reference is liable to contamination by the activity of the common electrode 11, 12 it is important to point out that our reference electrodes must have been quite inactive as shown by the fact that very low coherence values were common, among the wide range of values around the mean. Any low value means that the shared activity in the two channels due to the common electrode must have been small since any common signal gives coherence well above the bias level even when it is a small fraction of the total activity, and it does so in all channels, unless in particular channels it is swamped by exceptionally high power that is incoherent. For this reason we monitored the raw data and the power spectrum for exceptional events or artifacts. Evidence that volume conduction has little effect on our measurement is given below, under (iii).
The subdural records were digitized at 240 Hz after first order (RC) filtering, either from 1-70 or 1-100 Hz. The depth records were digitized at 200 Hz after similar filtering from 0.3-100 Hz. Coherence was computed by the Fast Fourier Transform (FFT) method and sometimes the autoregressive (AR) method, with a 12th order model. The FFT was preferred for longer samples or when bands were to be compared. The AR method is better for samples of <1 s. The FFT method has a more severe trade-off between frequency resolution, sample length and confidence of the coherence estimate; the AR method has a more severe problem with estimating confidence, stating the resolution and assuring independence of frequency bands.
Magnitude-squared coherence values were computed for each frequency and each pair of nearest neighbor electrodes in epochs down to 0.25 s and, when using the AR method, averaged over 1 to 3 s. Coherence values were usually corrected for the "bias" (the value expected for the case of minimal coherence, due to coincidence, from two independent sources; it depends on the duration of the sample, the length of the computing epoch and the frequency resolution; it assumes stationarity, linearity and independence of frequencies). The frequency band used for further calculation was either a single point or a fixed number of points, representing, for example 3 Hz, or a band of ca. 2/3 of an octave, namely 2-5, 5-8, 8-13, 13-20, 20-35, 35-50 Hz. Significance of differences between the large number of sample comparisons of coherence time series (pairs of electrodes, epochs, frequency bands, patients, states) was estimated by computing the 95% confidence interval for each value 13, 14. Statistics were done with a nonoverlapping window at the chosen resolution, one second or less.
|
|
Results |
|
|
|---|
For this study we computed coherence between adjacent electrodes (5-10 mm apart). The principal novelty is to compute for short epochs (0.25-4 s), creating a time series of values for each pair and frequency or band. These time series are the raw material of the study. We examine them for (i) magnitude and temporal distribution of the fluctuations, (ii) independence of frequency bands by correlating among bands from the same electrode pair and (iii) local sign by correlating neighboring pairs.
(i) Magnitude and temporal distribution of fluctuations. Inspection of large numbers of plots of the subdural, isocortical coherence time series for 7-15 electrode pairs, for each of the six frequency bands, in several samples of 1- 2 min in each of several states from four subjects shows a wide variety. Some show only small fluctuations (<0.2 = 20% of the range); this is more common if the mean coherence is high but also occurs when it is low or intermediate. Some show large swings (30-50% up to >70%). Most are intermediate. The excursions of coherence are often large when the mean coherence level is low and vice versa, but excursions can be large even with a high mean coherence. The larger hills and valleys can be isolated transients or quasi-rhythmic sets of a few cycles (Fig.1). Periods of 5-15 s are prominent and slower trends are common. Periods <2 s are minor but this may be partly the consequence of the high "bias" of short epochs. Little is to be learned from time resolution <2 s.
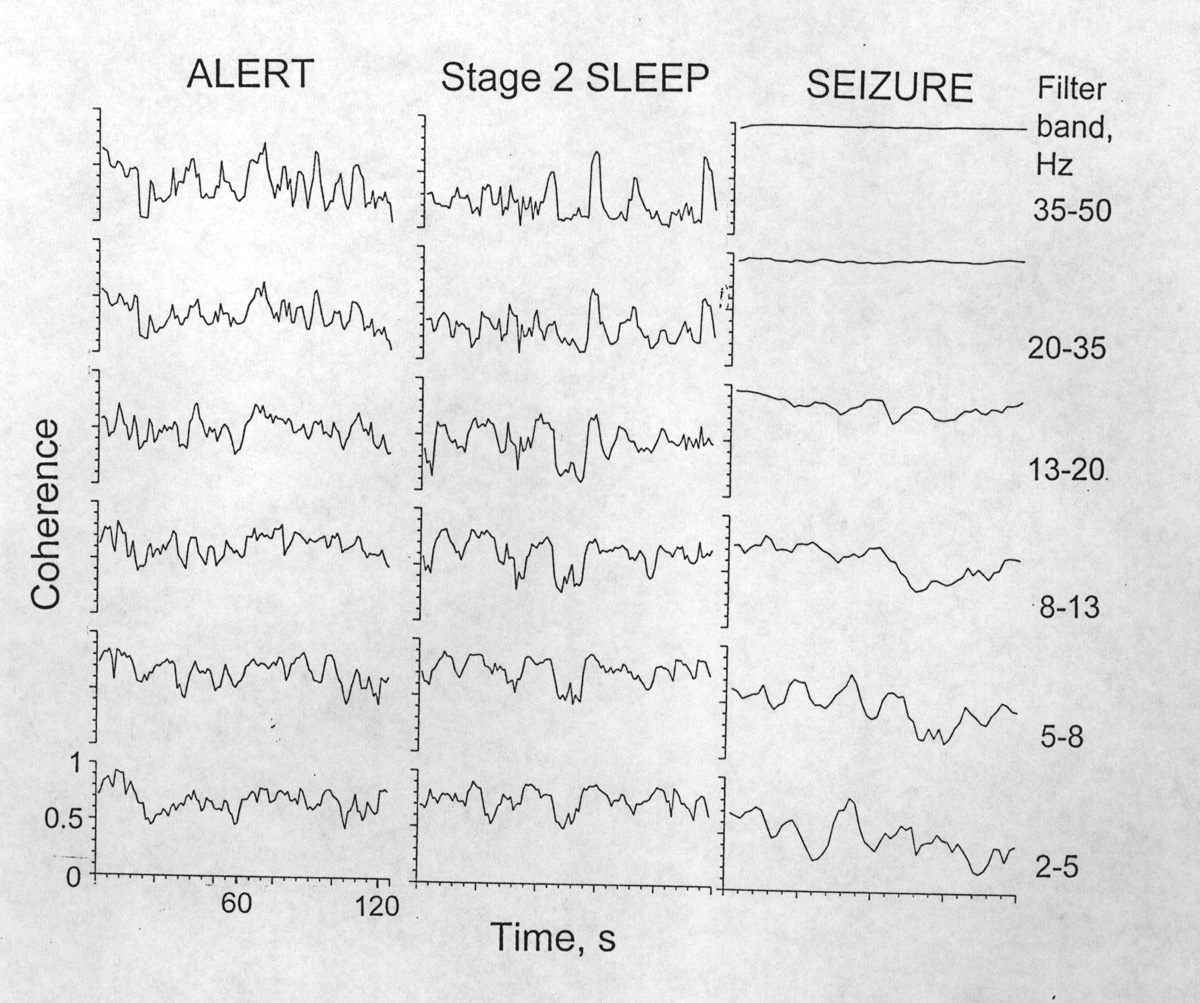 |
Figure 1. Time series of coherence values averaged over each of six frequency bands, from Patient K in three states, awake, asleep and during a seizure. Electrode pair 9 & 10 on right subfrontal cortex, 10 mm apart rostrocaudally. Spectral resolution 1.9 s; time resolution 1.07 s; coherence displayed over a 4 s sliding window. This example shows the species of coherence fluctuation with relatively large and quasi-rhythmic excursions. High bands are ceilinged out in seizures. [K02, 03, 04] |
The power spectrum of the coherence time series extends at least over 0.03-0.5 Hz and is generally weighted toward the slower frequencies, falling above 0.5 Hz. Spectra fall into two categories. One is like the spectra of artificial, stochastic data of similar power and pinkness. The excursions are small, mostly brief, in constant flux; its peaks are typically inconsistent in four successive samples of 30 s. The other category shows conspicuous, more or less regular fluctuations, most commonly in the range 0.05-0.2 Hz. Many cases are the quite aperiodic, the swings are irregular and merge into drifts. Although they cannot be statistically distinguished from the null hypothesis of a stochastic sequence of the same power spectrum, they characterize the dynamics at that time and place. Spectra can be read as periodograms but, apart from the tendency for taller peaks around the 10 s period, they are generally not consistent in successive samples.
A limited array of tests for nonrandom temporal structure in the coherence time series have been applied. Tests such as runs above median showed no difference from randomness. First lag autocorrelations are insignificant in the majority of data sets (a Spearman ranked order method was used since coherence values are not normally distributed). In a sample of 198 sets (pairs of electrodes, frequency bands, brain states), 36% were above two standard errors. This fraction of apparently nonrandom cases depends on the state and breaks down into 69% in the seizure data of patient K, 12% in sleep and 26% in wakefulness. Also the magnitude of the mean first lag autocorrelation is highest during seizures, lowest during sleep and intermediate in wakefulness. Coherence of certain frequency bands (8-13 and 35-50 Hz) is about twice as likely to show a significant first lag correlation as the other bands. This test, of course, does not exclude that significant structure exists in the time series without a first lag correlation, but indicates that the others have some dependency of successive 1 s epochs and encourages the search for evidence of periodicity or at least preferred durations of fluctuations. In our samples, where a best lag suggests periodicity it is generally between 4 and 20 s. Comparison of the time series with many shuffled series of the same values, by the method of Odell et al. 15 showed no consistent periodicities.
The two states, wakefulness and slow wave sleep show no consistent difference in subdural coherence time series. A small difference in grand averages of pooled subjects would have eluded our search. The seizure state is quite heterogeneous but coherence tends to increase, especially for higher bands of frequencies but often also at low bands, with a minimum in some middle band. The marked variation among samples is chiefly due to epochs or loci that are not yet in electrical seizure, but also to conspicuous differences visible in the raw record between early and late stages or forms of electrical seizure. No differences could be attributed to the lobe of the brain, with the limited data analyzed from each.
Depth recordings in the medial temporal lobe, principally from the hippocampus, show coherence fluctuations over time quite similar to the subdural recordings. Figure 2 shows the evolution of the coherence spectrum every 4 s during a pre-ictal period and the first 25 s of a seizure in a few electrode pairs. 3-D displays, topographic sections (Fig. 3) and the time series for narrow frequency bands each bring out distinct aspects of the dynamics, especially the wide variety of shapes and temporal patterns among the three seizures in each of the three patients. Most hills and valleys have a half width of ca. 5 s or more and an excursion in coherence of up to 0.5 or more. Rhythmic oscillation is rare; narrow spectral peaks are virtually absent. Deep, narrow valleys occur with high plateaus. The whole pattern or texture of the 3-D surface can change markedly within 5 s, as well as from one pair of adjacent electrodes to the next. This is remarkable considering the close spacing (6.5 mm) and the large surface (2 mm long) of the metal collar forming each electrode. In all nine samples the coherence between one electrode in the left hippocampus and the electrode believed to be homotopic on the right, during the pre-ictal period, is not notably high or low. The same is true of homotopic subdural loci on the inferior temporal gyrus and on the fusiform gyrus. Notably low in all bands is the coherence between some neocortical and hippocampal sites.
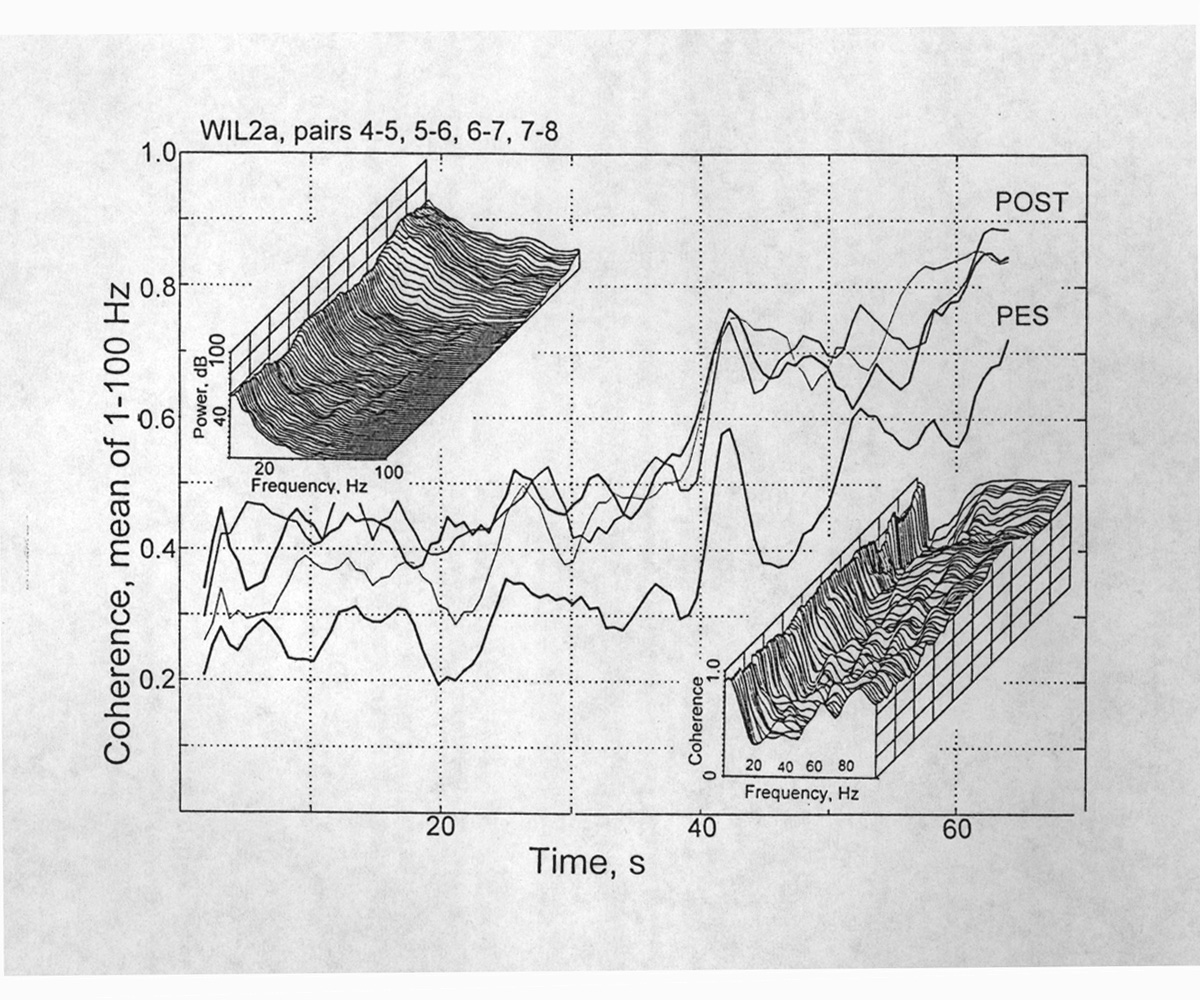 |
Figure 2. Time series of coherence values averaged over all frequencies from 0-100 Hz, from depth electrodes in Patient W before and during development of a seizure, starting at 39 s. Four pairs of electrodes, 4&5, 5&6, 6&7, 7&8, 9 mm apart, located in the posterior and the pes hippocampi. Upper left insert is the power spectrum, displayed in 3D over time (120 s), showing increased power in all frequencies with development of the seizure. Lower right insert is the corresponding time course of the coherence spectrum. [Wil2a] |
The influence of state can only be examined for the preictal and ictal states in our depth probe data (Fig. 3). During the nine seizures in three patients, a rise over the whole frequency range was general. At the height of a seizure, coherence exceeds 0.9 over a wide band, like a smooth plateau - although the power spectrum at this time has high, jagged peaks with deep valleys and falls off steeply above 40 Hz. The coherence plateau generally has a steep valley at a low frequency, ca. 2-4 Hz. Rather often among seizures some electrode sites are little or not appreciably involved; even adjacent pairs can be drastically different. The beginning of these seizures is typically gradual but can be identified within 1-2 s in the raw EEG and within one analysis epoch of 2-5 s in the power spectra. It is not more obvious in the coherence spectrum vs time. The independence of power and coherence is striking. Although they are on average positively correlated, quite frequently they move in opposite directions or show no correlation.
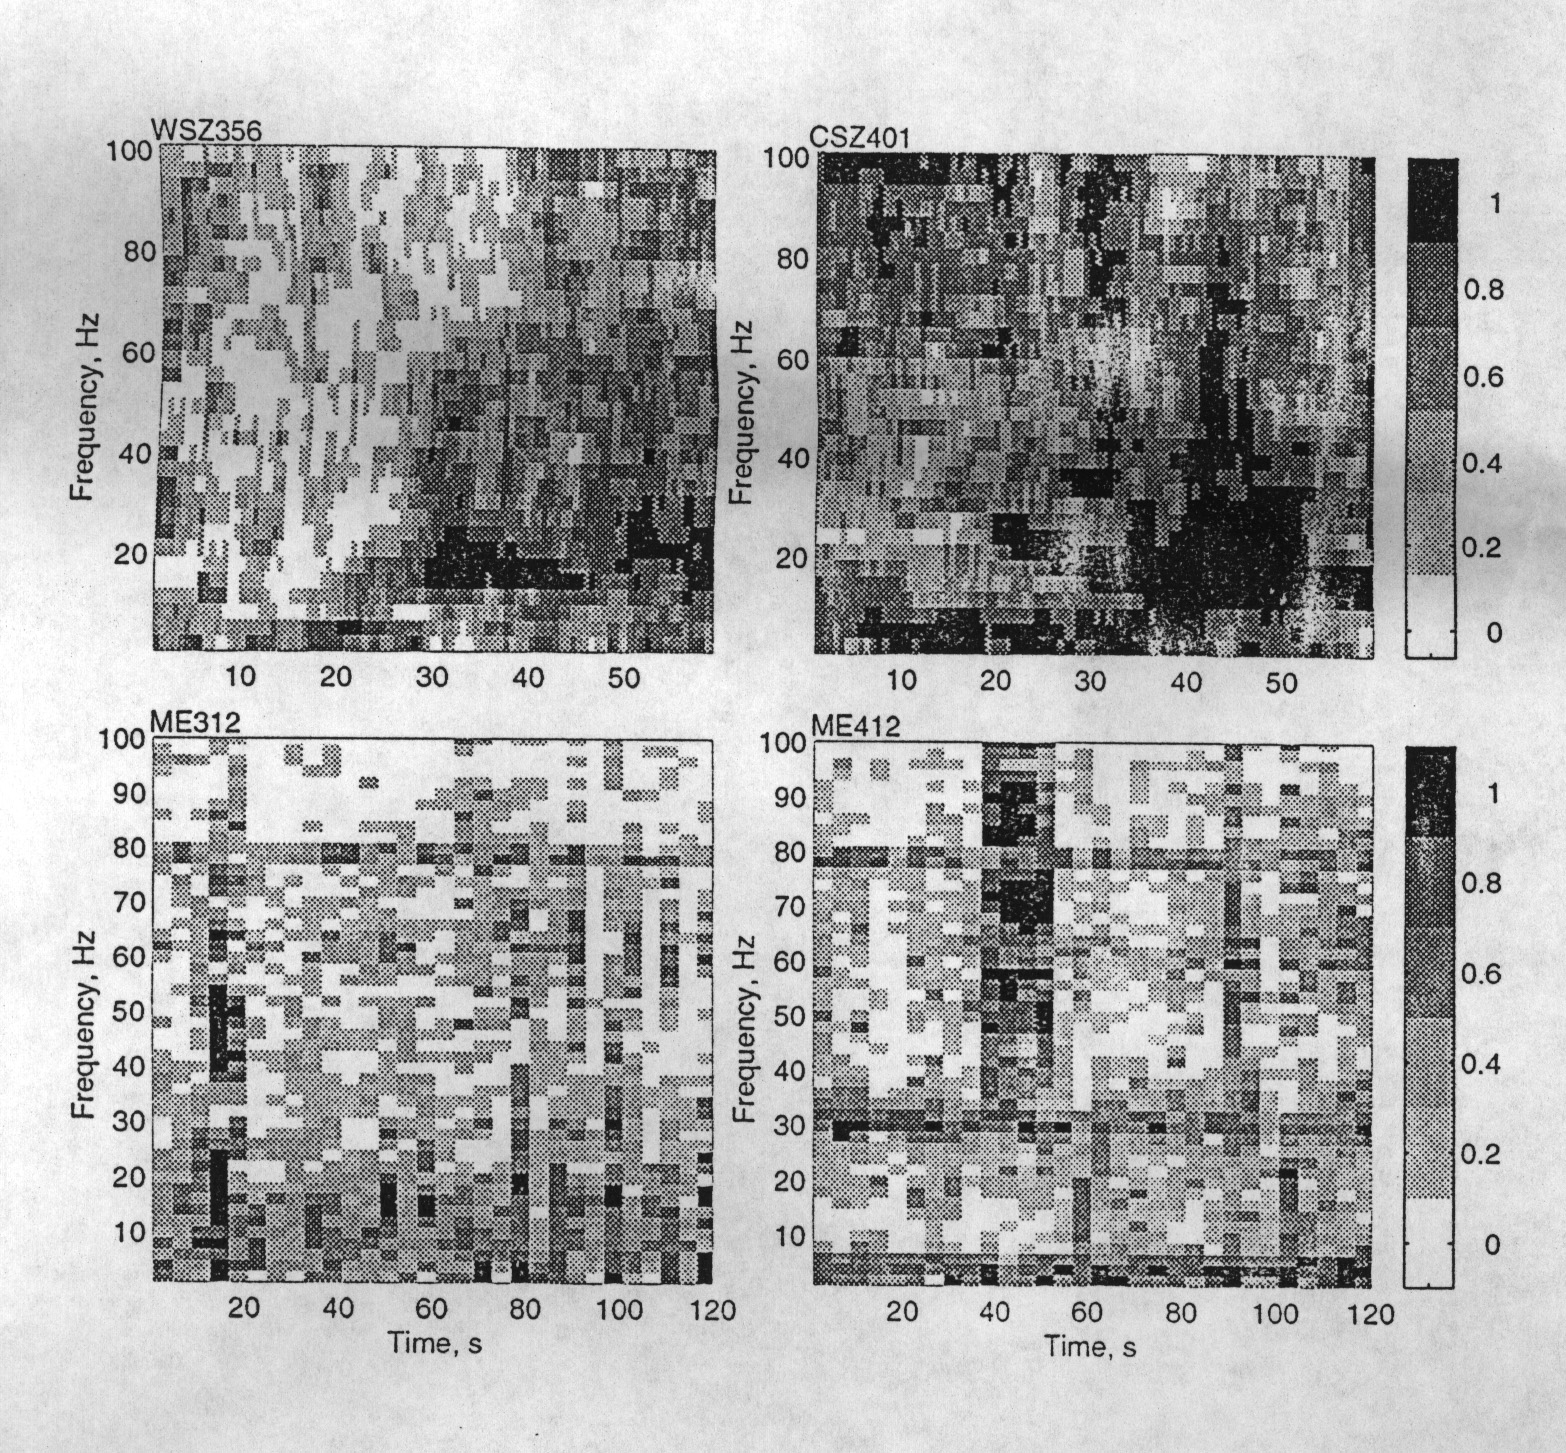 |
Figure 3. Topographic display of the fluctuations of coherence (calibration scale at right) at each frequency over time. Top row: Two samples from Patients W and C and particular pairs of adjacent depth electrodes in the hippocampus (9 and 6.5 mm apart, respectively), showing preictal EEG and the first portion of a seizure in each. The seizure in W (WSZ3, upper left) in channel 5 begins at 25 s and continues beyond the plot. Note that coherence increases at first from 10-65 Hz then spreads to all frequencies. The seizure in C (CSZ4, upper right) in channel 0 begins at 20 s and has a somewhat different pattern. Bottom row: Two samples from Patient Me during sleep (ME3, left) and wakefulness (ME4, right) from the same pair of electrodes show differences which, however, are not consistent among episodes or subjects. Note the visible correlation across frequencies (vertical stripes) and the sustained tendency toward higher coherence at 80 Hz in both, and at 4, 6 and 30 Hz in wakefulness (horizontal stripes). |
(ii) Evidence against independence of frequency bands. Correlation of the coherence time series of different bands points to a marked degree of parallelism. The grand mean correlation of adjacent bands (2-5 & 5-8, 5-8 & 8-13, 8-13 & 13-20, 13-20 & 20-35, 20-35 & 35-50 Hz) from the same subdural electrode pair, averaged over many pairs and both sleeping and waking states is 0.50 (see Table 1 for 95% confidence intervals and Ns) for patient Me, 0.37 for Ma, 0.49 for K, 0.45 for R. The correlations drop for adjacent-but-one bands (2-5 & 8-13, ...) to 0.25, 0.07, 0.18, and 0.17 for the same subjects. They drop further, sometimes below statistical significance, for adjacent-but-two bands (2-5 & 13-20, ...) : 0.14, 0.00, 0.11 and 0.10; sometimes the positive values are quite significant, as shown in the table. The correlations for these four subdural sets of data are quite similar to those for the depth electrode data from the temporal lobe and hippocampus; no difference was noted in this measure (Table 1). The lowest bands are most correlated; the bands above 5-8 Hz are all quite similar in strength of correlation.
| Patient & state | Adjacent band | Adjacent-but-one | Adjacent-but-two |
| "Me"; mean of sleep & awake | .50 .03 224 | .25 .03 168 | .14 .04 112 |
| Seizure | .57 .05 112 | .34 .08 84 | .23 .11 56 |
| "Ma"; mean of sleep & awake | .34 .02 300 | .07 .03 240 | .00 .03 180 |
| Seizure | .59 .05 60 | .39 .06 48 | .33 .07 36 |
| "K"; mean of sleep & awake | .49 .03 240 | .18 .04 192 | .11 .04 144 |
| Seizure | .55 .09 60 | .15 .12 48 | -.01 .13 36 |
| "R"; mean of sleep & awake | .45 .03 280 | .17 .04 210 | .10 .05 140 |
| "C"; awake; preictal | .40 .05 180 | .11 .06 144 | .05 .07 108 |
| Seizure | .49 .04 180 | .17 .05 144 | .08 .06 108 |
| "H"; awake; preictal | .44 .05 180 | .12 .05 144 | .08 .06 108 |
| Seizure | .50 .04 225 | .27 .05 144 | .20 .06 108 |
| "W"; awake; preictal | .44 .04 225 | .15 .05 180 | .08 .05 135 |
| Seizure | .50 .04 225 | .17 .05 180 | .14 .06 135 |
Among the states, correlation of bands is higher during seizures, especially in the higher bands. Sleep and alertness are not significantly different, on the average, in our samples.
(iii) Evidence of local sign in spatial differentiation is strong. The lack of strong parallelism of the time series in neighboring pairs, sharing one electrode, underlines the spatial differentiation reported by Bullock et al. 9. At a center-to-center distance of 10 mm between nearest neighbor pairs, the average correlation pooling all the pairs, bands and samples from the alert and the slow wave sleep states in 4 subdural patients is 0.22 and the deep temporal data are not significantly different. On the internal evidence, barring large fluctuations in the impedance or the amount of noise, these values cannot be much influenced by volume conduction. Even at 5 mm, volume conduction does not guarantee high coherence. Each electrode locus has a coherence with each locus around it that can be high or low, is generally different for each electrode pair, and varies with time in a partly parallel, partly independent way among the pairs. At 20 mm between pairs of electrode pairs, the correlations of coherence time series are lower. The few pairs of pairs 30 mm apart average still lower correlations, commonly below the level of significance. Conspicuous discontinuities occur at one or two boundaries along the >50 mm row of electrodes, even between nearest neighbor pairs, indicating local sign within <10 mm. The localization of electrode sites is not adequate to specify the histological position of these discontinuities but they appear to be within the limits of the hippocampus. A similar finding of abrupt discontinuities was reported from the rat in mean coherence over many seconds, rather than in parallel fluctuations of high time resolution estimates 5. It is relevant both to this paragraph and the preceding section (ii) that these discontinuities are at the same location in coherence time series for different, even widely separate frequency bands, probably for all bands if we had enough data. Comparison of states shows that correlations are higher during seizures, on average, but seizures are diverse and correlations are sometimes low.
|
|
Discussion |
|
|
|---|
The three main findings from subdural and depth EEGs largely contradict prevailing views derived from the scalp EEG.
(i) Coherence is dynamic in the domain of seconds. It can fluctuate either slightly or with large excursions, either irregularly or in bursts, with periods mostly from 5-15 s.
(ii) Coherence fluctuations are basically local, correlating weakly between pairs 10 mm apart. Differentiation of this sign of cooperativity is high, extending the evidence for local structure reported recently 9 from longer epoch averages. Plots of coherence between neighboring loci in a row, over time, show a great variety of patterns, in the domain of millimeters and seconds, although they are smoothed by the large surface of our electrodes. This does not contradict the known long distance coherence of scalp-recorded EEGs but calls for revision of models.
(iii) EEG frequency bands are not independent. The usual model of the EEG is based on the assumption of the Fourier analysis - that a number of oscillators are independent. We find frequency bands tend to fluctuate in coherence together, over time as well as space, even bands more than an octave apart (e.g. 5-8 and 13-20 or 20-35 Hz).
We find no consistent distinguishing features of the coherence time series for the parts of the brain or for sleeping and waking states, probably due to limitations of our samples. There is no signature of seizures but, as in the raw EEG and in the power spectra, a variety of coherence patterns accompanies the different forms and stages of development of seizures.
The findings support the following view of the electroencephalogram. Oscillators are not the main basis of the EEG most of the time, though half a dozen occur, including delta, theta, alpha and gamma rhythms and some subcategories, one or two at a time, under special conditions (e.g. awake with eyes shut, paradoxical sleep, exploratory walking in rat), sometimes clear only in certain species. Wide-band EEG is always there, much of the time without recognizable rhythms, at other times with rhythmic power peaks superimposed. The wide-band cortical EEG such as that dominating in all our samples is not likely to be primarily based on a mixture of real rhythms of many frequencies, especially independent sinusoidal generators. It may arise in a variety of episodic events with relatively sharp corners, such as synaptic potentials, steps, plateaus, concurrent spikes and others with varying degrees of synchronization. All intermediates can occur between the stand-out, sustained rhythms and the wide-band activity with insignificant or fluctuating peaks. It remains to be learned for most behavioral states what the relative contribution is of the various forms of generator (independent, trombone-like, variable frequency oscillators; interacting oscillators; wide-band, episodic generators, football stadium-like with variable coherence) and mechanisms of synchrony. Further work on coherence between many pairs, at close spacing, with extracellular microelectrodes at depth, as well as on the surface, is one of the best hopes.
A limited literature has pointed to short term and longer term shifts in coherence, which may be extremely local 16, 17, 18, 19. We have found few other reports of local patterned mosaics of fluctuating coherence 20, 21, 10 . There are numerous indications that the spatial and temporal structures of dynamic functional features can be quite local in space and transient in time 16, 22, 17, 23, 24, 25 .
It is important to underline that the picture presented here is not only different from the classical one based on scalp recorded EEG but also from that based on microelectrodes within the brain. Our electrodes are large and may be separated from the neural tissue by a fluid layer. Bullock and McClune 1 extended older observations of Elul 26 with pairs of intracortical micropipettes and found even more local sign and variance than subdural electrodes see. Further work with this approach is needed; we expect it will substantially extend to smaller dimensions the microstructure of the EEG in space and time.
Aided by grants from the National Institute of Neurological Diseases and Stroke.
|
|
References |
|
|
|---|
1. Bullock, T.H. & McClune, M.C. (1989) Electroencephalogr. Clin. Neurophysiol. 73, 479-498.
2. Bullock, T.H. (1988) in Dynamics of Sensory and Cognitive Processing by the Brain, ed. Baar, E (Springer-Verlag, Berlin), pp. 3-18.
3. Bullock, T.H. & Baar, E. (1988) Brain Res. Rev. 13, 57-75.
4. Bullock, T.H. (1989) in Brain Dynamics: Progress and Perspectives, eds. Baar, E. & Bullock, T.H. (Springer-Verlag, Berlin), pp. 5-12.
5. Bullock, T.H., Buzsáki, G. & McClune, M.C. (1990) Neuroscience 38, 609-619.
6. Bullock, T.H. (1991) in Nonlinear Dynamics and Neuronal Networks, ed. Schuster, H.G.(VCH Verlagsgesellschaft, Weinheim, Germany, pp. 257-266.
7. Bullock, T.H., Achimowicz, J.Z. & McClune, M.C. (1992) Soc. Neurosci. Abstr. 18, 906.
8. Bullock, T.H. & Achimowicz, J.Z. (1994) in Oscillatory Event Related Brain Dynamics, eds. Pantev, C., Elbert, T. & Lütkenhöner, B (Plenum Press, New York), pp. 11-26.
9. Bullock, T.H., McClune, M.C., Achimowicz, J.Z., Iragui-Madoz, V.J., Duckrow, R.B. & Spencer, S.S. (1995) Electroencephalogr. Clin. Neurophysiol. (In press)
10. Duckrow, R.B. & Spencer, S.S. (1992) Electroencephalogr. Clin. Neurophysiol. 82, 415-422.
11. Fein, G., Raz, J., Brown, F.F. & Merrin, E.L. (1988) Electroencephalogr. Clin. Neurophysiol. 69, 581-584.
12. Rappelsberger, P. (1989) Brain Topography, 2, 63-72.
13. Gardner, M.J. & Altman, D.G. (1986) Br. Med. J. 292, 746-750.
14. Cohen, J. (1994) Am. Psychol. 49, 997:1003.
15. Odell, R.H., Jr., Smith, S.W. & Yates, F.E. (1975) Ann. Biomed. Eng. 3, 160-180.
16. Eckhorn, R., Bauer, R., Jordan, W., et al. (1988) Biol. Cybern. 60, 121-130.
17. Gray, C.M., König, P., Engel, A.K. & Singer, W. (1989) Nature (Lond.) 338, 334-337.
18. Prechtl, J.C. (1994) Proc. Natl. Acad. Sci. U.S.A. 91, 12467-12471.
19. Bragin, A., Jandó, G., Nádasday, Z., Hetke, J., Wise, K. & Buzsáki, G. (1995) J. Neurosci. 15, 47-60
20. Petsche, H., Pockberger, H. & Rappelsberger, P. (1984) Neuroscience 11, 1-27.
21. Petsche, H., Pockberger, H. & Rappelsberger, P. (1988) in Dynamics of Sensory and Cognitive Processing by the Brain, ed. Baar, E. (Springer-Verlag, Berlin), pp. 123-139.
22. Boeijinga, P.H. & Lopes da Silva, F.H. (1989) Electroencephalogr. Clin. Neurophysiol. 73, 198-205.
23. Lopes da Silva, F.H., Pijn, J.P. & Boeijinga, P. (1989) Brain Topogr. 2, 9-18
24. Scheuler, W., Rappelsberger, P., Schmatz, F., Pastelak-Price, C., Petsche, H. & Kubicki, S. (1990) Electroencephalogr. Clin. Neurophysiol. 76, 222-234.
25. Lehmann, D., Michel, C.M., Pal, I. & Pascual-Marqui, R.D. (1994) Int. J. Neurosci. 74, 239-248.
26. Elul, R. (1972) Int. Rev. Neurobiol. 15, 227-272.