![]() Top
Top
![]() Summary
Summary
![]() Introduction
Introduction
![]() Methods and Materials
Methods and Materials
![]() Results
Results
![]() Discussion
Discussion
![]() References
References
|
|
|---|
A. Schuett1, E. Ba-ar1 and T. H. Bullock2
1 Institute of Physiology, Medical University of Luebeck
23538 Luebeck, Germany
2 Department of Neurosciences, School of Medicine
University of California, San Diego
La Jolla, CA 92093-0201, U. S. A.
Running title: Odorant-induced activity of the Helix brain.
Address for proofs: Atsuko Schuett
Institute of Physiology
Medical University of Luebeck
Ratzeburger Allee 160
23538 Luebeck, Germany
e-mail: schuett@physio.mu-luebeck.de
phone: 0451-500 4180
fax: 0451-5004171
List of abbreviations:
AFP Amplitude-Frequency-Plot
EEG electroencephalogram
FP field potential
PC procerebrum or procerebral
RMS root-mean-square
VG visceral ganglion
|
|
Summary |
|
|
|---|
To test the hypothesis that different
odorants are likely to cause distinctive changes in the ongoing
electrical activity of populations of olfactory cells, we investigated
field potentials (FP) in the Helix brain and their alterations
by odorants as seen by semimicroelectrodes in an isolated preparation
of the rostrum with ist olfactory organ and whole central nervous
system. Five pure chemicals and two natural odorants were applied
as stimulants. Signals recorded both from the procerebrum (PC)
and the visceral ganglion (VG) were analyzed. In the PC the five
pure chemical odorants induce stimulus-specific characteristic
responses, mainly in the low frequency range (<15 Hz). Regardless
of odor intensity, the frequency of the peak power of sustained
induced activity is constant for each chemical: ammonia at 0.2
( <0.02 Hz; formic acid at 0.36 ( 0.03 Hz; 2-pentanol at 0.48
( 0.04 Hz; 2-butanol at 0.67 ( 0.03 Hz; ethanol at 1.31 ( 0.09
Hz (means ( 95% confidence limits). These peak power frequencies,
which we define as (odor-specific frequencies(, are confined to
the low frequency range of < 2.5 Hz. Those of natural odorants
are: onion (0.36 ( 0.14 Hz) and apple (1.1 ( 0.25 Hz). The activities
evoked in the PC propagate to VG. The order of behavioral aversion
determined by withdrawal reactions of the tentacles, 1% ammonia
> formic acid > 2-pentanol > 2-butanol > ethanol,
coincides with (the order of molecular affinity( as well as with
the sequence of peak power frequencies. There seems to be a strong
correlation among behavioral valence, chemical nature of an odorant,
and odor-specific frequency. The finding that, in the Helix olfactory
center, odor input is processed as odorant specific low frequency
FP activity may represent some general phenomena of olfactory
information processing.
Keywords. olfactory; Helix pomatia; field potentials; frequency
analysis; behavior
|
|
Introduction |
|
|
|---|
Odor stimulation brings neurons of
olfactory centers into rhythmical activity (Adrian 1942; Mellon
1992; Chase 1993). Oscillations have been observed in the olfactory
systems of various vertebrates, such as fish, frog, turtle, rodent,
opossum, rabbit, cat and human (Tank et al. 1994). Recently, odorant-induced
field potentials (FPs) have been recorded from the olfactory systems
of invertebrates, such as slug (Limax)(Gelperin 1994; Gelperin
and Tank 1990, Gelperin and Flore 1997; Gelperin et al. 1993;
1996; Kimura et al. 1993; Kleinfeld et al. 1994; Gervais et al.
1996), land snail (Suzuki 1967; Balaban and Maksimova 1993; Schuett
and Ba-ar 1994); locust (Laurent and Davidowitz 1994; MacLeod
and Laurent 1996; Laurent et al. 1996). Odor induced modulation
of FP oscillations has also been observed in vertebrate olfactory
systems (Freeman 1975; Bressler and Freeman 1980; Eckert and Schmidt
1985; Delaney and Hall 1996; Duchamp-Viet et al. 1990). In humans,
odor-evoked as well as event-related potentials have recently
been studied by a number of authors (Kobal and Hummel 1988; Klemm
et al. 1992; Zatorre et al. 1992; Van Toller et al. 1993; Evans
et al. 1995; Lorig et al. 1991, 1995; 1996). These authors now
predict that the oscillations in potential, which are modulated
by odor-input, may have a functional role in odorant encoding.
Molluscan central nervous systems exhibit spontaneous local field
potential fluctuations which are both oscillatory and non-oscillatory.
When one of the large cells happens to dominate the record (or
a few units, well synchronized), the broad spikes are likely to
be quite periodic, with a slowly shifting frequency; the great
energy in the afterpotentials add a large component to the power
spectrum in the < 3 Hz bands. When the recording locus avoids
such units, as in most of the records analyzed here, it is usual
to observe no oscillation standing out from the wideband activity.
Peaks in the power spectra are usually not in a consistent position
(frequency) in successive spectra. But interesting exceptions
will be reported here. Electrical stimulation evokes in these
ganglia slow waves with frequency components comparable to delta,
theta, alpha, beta and gamma bands of mammalian EEG, that is energy
throughout a broad range from < 2 Hz to > 30 Hz, though
not consistently peaked at fixed frequencies.
Studies with a variety of species (snail, fish, cat and human)
have compared the similar frequency components of stimulus-induced
brain electrical activities, to look for shared basic aspects
of information processing in the brain (Ba-ar et al. 1999; Bullock
and Ba-ar 1988; Sturbeck 1988; Ba-ar-Eroglu and Ba-ar 1991; Bullock
1992; Schuett and Ba-ar 1992; Schuett et al. 1999).
The aims of the present study were: first, to test the hypothesis
that different odorants can elicit distinctive changes in the
ongoing electrical activity of populations of cells; second, to
relate the changes to behavior in an attempt to find a candidate
odor-encoding mechanism. We apply the technique of extracellular
recording using semimicroelectrodes to measure population responses
of the Helix procerebral lobe and the visceral ganglion as field
potentials. The analytical procedure is based on frequency analysis
and allows detection of subtle changes of amplitudes of frequency
components. This study consists of three parts. First, we characterized
the patterns of odor-elicited changes in the procerebrum (PC).
Second, we repeated the same in the visceral ganglion (VG). Third,
to elucidate the behavioral relevance of these induced activity
patterns, we determined degree of aversiveness for each stimulant
in active snails.
|
|
Materials and Methods |
|
|
|---|
Preparation
The preparation of the isolated whole central nervous system with
the intact antennal sense organs was removed from 15-30 g Helix
pomatia (Dealer: Exoterra, Deringen, Germany). The animals were
anesthetized by immersing in crushed ice for 40 min, after which
the head and foot part was quickly separated from the rest of
the body. The entire central nervous system was then isolated
together with the superior tentacles and the olfactory nerves.
The whole cerebral ganglia including the PC lobe were kept intact,
but the VG was desheathed. The whole preparation was then transferred
to the experimental chamber and fixed by holding the subesophageal
ring lightly by a fine pin stuck in the silicone rubber bottom.
The chamber contained 0.5 ml of a modified snail saline (Witte,
et al. 1985)(130 mM NaCl, 4.5 mM KCl and 9 mM CaCl2, buffered
with 5 mM HEPES-Na and adjusted to pH 7.5 with HCl) and was kept
at 19(1oC. The preparation was immersed in saline except the receptor
surface of one tentacle ipsilateral to the recording site.
Recording
For recording, two stainless steel semimicroelectrodes (Rhodes
Medical Instruments SNE-300) with a shaft diameter of 100 m (impedance
< 100 kohm at 1000 Hz) were used. The electrodes were both
varnished to the tip and the recording was carried out against
a distant electrode in the bath. For PC, the recording electrode
was positioned directly on top of the sheath, away from the entrance
of antennal nerves. For the visceral ganglion, the electrode was
placed on the desheathed surface, in the central to lower part.
The electrode was placed on the surface carefully avoiding any
position where it recorded activity dominated by one or a few
large unit spikes. These large unit spikes may respond to an adequate
stimulus by large and long lasting afterpotentials in both directions
(afterdepolarization and afterhyperpolarization) having a significant
power and frequency components going down to < 1 Hz. An important
caveat is that we do not have any assurance in this molluscan
preparation that the potentials all come from neurons; tissue
near the electrodes may include smooth muscle and connective tissue
whose possible contribution, especially to slow potentials, cannot
presently be assessed. The activity was constantly monitored on
a digital oscilloscope.
Data processing
For data acquisition and analysis, we used a software package
specially developed by BrainData( (Luebeck, Germany).
After wide-band filtering at 0.1-100 Hz, the analog signals, 18000-36000
times amplified, were continuously digitized at 200 Hz in epochs
of 2048 samples (10.240 sec). For each experimental condition,
20 epochs = 204.8 sec were recorded without interval between epochs.
The digitized data were stored in a computer and subsequently
transferred to an optical disc for off-line data processing. Data
analysis, performed off-line, used another computer, and included
power spectra (0.1 Hz resolution) for single epochs to observe
changes of transient activities and the (Frequency-Amplitude-Plot
(FAP)(, G(j(), of the averaged signals based on all 20 epochs.
Frequency-Amplitude-Plot (FAP)
A power spectrum can be applied as an analytical tool for a system
which fluctuates, such as the EEG or ganglionic activities. When
odorants are administered to the sense organs, the ongoing field
potentials of the snail ganglia change patterns and these can
be characterized in frequency and amplitude.
We used the (Method of Transient Response Analysis( (Frequency-Amplitude-Characteristics
measurement) to characterize these transient responses in frequency
and amplitude (Ba-ar 1980; 1999a).
The frequency-amplitude-characteristics of a fluctuating system
can be described by the following equation. We call the resulting
plot, which depicts each frequency and its amount of activity
as relative amplitude, the (Frequency-Amplitude-Plot((FAP).
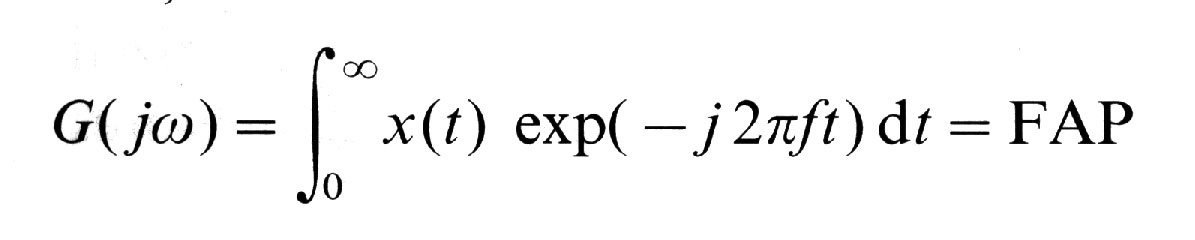
where x(t) = the time history of the
pattern to be analysed, G(j() = complex representation of the
Fourier-transformed time series, ( = 2(f , the angular frequency,
f = frequency of the input signal, and , the imaginary unit.FAP
is like a filter which, if applied to white noise, would yield
the observed power spectrum. FAP attempts to emphasize the relative
heights of peaks in each sample de-emphasizing their absolute
power by normalizing to the power of the lowest frequency passed
by our filter. We do not claim this value has a unique comparability
across samples of activity and therefore, the zero of the ordinate
is arbitrary and fluctuates, relative to all other frequencies,
depending on the amount of very slow potential shift (0.1 Hz and,
with some attenuation, lower frequencies) at that time.
In an attempt to define the properties of the seemingly quasi-oscillations
of the snail ganglia, we applied this method of FAP measurement.
For this purpose we used a spectral averaging method (averaging
in the frequency domain): We first computed Frequency Characteristic
of each epoch (10.24 sec) and then the average of all 20 epochs
(=204.8 sec) as average FAP. To determine the peak power frequency,
at which power increase was largest, we subtracted the average
FAP of the control from that of the response, manually plotted
the difference and estimated the frequency, at which the power
increase was largest. When the increase was strong, the peak power
frequency matched that of the ongoing activity during odor exposure.
The low frequencies, including 0.1 Hz and lower frequencies, that
are present even if attenuated by the filter, will be in random
phase during the 10 s epoch and so the estimate of DC potential
jumps around accordingly. The fluctuating values at the ordinate
thus reflect the mean voltage over the 20 ten second epochs. The
main effect of the random (DC( is that the position of the zero
on our ordinates is (arbitrary( - in the sense that it has no
interpretable significance for us and fluctuates by chance between
curves or figures. The averaging starting at essentially random
times obviously attenuates higher frequencies faster than lower
frequencies.
We also plot power spectra of 20 individual epochs, 10.24 sec
each, for each trial, study the time evolution of the spectral
pattern, visually estimate the affected frequency range as well
as the peak power and compare them with those detected in the
corresponding FAP computed from the average of all the 20 trials
(204.8 sec).
RMS-voltage
The time signals were also digitally filtered in different frequency
bands. The pass-bands of 0.5 - 15 Hz or 0.1-15 Hz were arbitrarily
chosen for the evaluation of Root-Mean-Square (RMS)-voltage (
V), since olfactory response occurs mainly in the range < 15
Hz. An additional pass-band of 15-50 Hz was also applied to determine
RMS-voltage of the high frequency component of VG. Root-mean-square
(RMS)-voltage ( V) of the filtered signals of each epoch, XRMS,
and the mean RMS-voltage of all 20 epochs were then computed.
Fourier transform and digital filters are as described in Ba-ar
(1980).
Odor response
Control activity was recorded just before each series of odor
tests.
The odor was applied by placing a piece of filter paper, stuffed
into a glass barrel (3-4 mm in diameter) and lightly soaked with
the odorant, 1 to 2 mm away from the neuroepithelium. A sample
of 20 epochs (=204.8 s) was recorded every 5 min starting immediately.
The stimulus was then removed and two to three additional recordings
were made. In some cases recordings were continued for some time
to observe the changes much longer. Odorants were administered
at least at four different concentrations (from just above threshhold
to submaximal) to show that odor intensity was not so strong as
to cause nociceptive components of response. (For all odorants,
the effects of maximal intensities were also investigated for
the purpose of comparison.) The intensities of odorants administered
were: ethanol (99.8%):undiluted to 1:32; 2-butanol: undiluted
to 1:64; 2-pentanol: undiluted to 1:64; formic acid: undiluted
to 1:64; ammonia: 1% to 0.01%. A recovery time of 10-15 min (or
till the spontaneous discharge seemed to have returned to normal)
was allowed between trials.
Degree of aversion
To estimate the degree of aversion, we tested the odorants described
above on a number of active snails, which were later used in the
in vitro experiments.
First, as the parameter for degree of aversion, the distance between
the superior tentacles and the odorant, at which the tentacles
were quickly withdrawn, was estimated. Formic acid, 2-pentanol,
2-butanol, ethanol (99.8%), onion juice and apple juice were applied
without dilution. For ammonia we chose 1% solution. The speed,
at which the odor source was manually moved from a distance, was
kept at approximately 3-4 cm/sec. We observed by eye when the
tentacles withdrew and where the source was at that moment. Of
course, a latent period of unknown length probably varies with
substance and concentration, so the distance was actually greater
when the snail sensed the average stimulus. We allowed a few minutes
of rest between the trials.
Second, we measured latency in terms of visible withdrawal of
the tentacles as the parameter of aversion to examine whether
this parameter was related to that estimated in distance. An odor
source, a piece of filter paper soaked with an odorant, was shielded
in a microtube and placed ca. 1 cm from the tentacle. The shielding
lid was quickly opened and the latency was determined. The chemicals
were undiluted except ammonia which was at 1%. Several trials
were made for each odorant with two of the active snails described
above. An interval of 5 min or longer was allowed between trials.
Statistical evaluation
To give confidence in the results, we calculated 95% confidence
limits for the average according to (Student( (Youden 1964).
|
|
Results |
|
|
|---|
Description of activity
We consider that the boundary between (regular( and (irregular(
fluctuation is arbitrary and varies according to the frame of
reference. In our usage variation of period less than ca. .5 of
an octave justifies the term "oscillation". We point
out that according to this definition the snail activities are
mostly non-oscillatory ( Figs. 1a,b; Figs. 2a,b; Fig. 3a,b). In
the present study we avoided such recording sites where large,
rhythmic spike-like discharges were conspicuous. The type of activity
observed in the PC lobe and VG may be called a quasi-oscillation
with a whole octave of fluctuation. To control any noise from
the recording system, we also measured (bath controls( with one
electrode on an inactive preparation and another in bath fluid.
RMS-voltages obtained on four different days were 1.4 - 1.8 V
in the 0.5-15 Hz band and < 1.0 V in the 15 - 30 Hz range.The
intrinsic PC and VG activities were normally higher than the bath
controls.
When odorant stimulation was applied to the sense organ, the activity
pattern of the PC or VG was distinctively modulated in frequency
and amplitude both in PC and VG. We define the change from control
as the ganglionic (response(. This often took place as intermittent,
strong spike-like discharges and we define this type of high activity
as (bursts(.
In an attempt to characterize these activities, we recorded the
responses of the ganglia to different odorants and analyzed them
in various parameters. As stimulants, we applied five chemicals
of different properties and, in case of PC, additionally two natural
odorants, onion and apple.The results are summarized in Tables
1 and 2. We point out notable features of the activities in the
following.
|
|
Table 1. Odorant-induced ongoing activities in the Helix procerebrum. a) Number of all preparations tested.; b) Number of all trials made with all the preparations; c) Number of preparations and d) number of trials made with the preparations , in which particular responses were observed. Peak power frequency (Hz) (estimated from the single power spectra and average FAPs, weighting them on the curves obtained by subtracting the FAP curve of control from that of responses) varied within the range shown. Range (Hz) indicates the frequency range, in which power changed. That range coverd those of all particular responses varying intra- and interindividually. (cf. Examples for ethanol and formic acid are shown in Fig. 5). Note that, in spite of a large variation, percent change of the amplitude (RMS-voltge in the 0.5-15 Hz range; for ammonia at 0.1-15 Hz) seemed to suggest a certain dependency on odor intensity. The rate of percent change appeared to be different for each odorant and may also be considered to be related, not only to odor quantity, but to odor quality. |
Procerebrum
Activity in the absence of odor
The PC lobe showed intrinsic FP fluctuations mainly in the low
frequency band < 15 Hz. The frequency maxima of controls (the
first of a series of experiments made with each of twenty preparations)
varied between 0.2 and 1.3 Hz, but mostly between 0.4 and 0.7
Hz (0.54 ( 0.11 Hz, 95% confidence limits). The power decreased
with increasing frequency (15 dB/octave). The RMS-voltage of the
ongoing activity in the 0.5 - 15 Hz range was most often less
than 4 V,
occasionally reaching 7 V.
Odorant-induced activity
Ethanol. As shown in Tables 1 and 3, ethanol evoked in the PC,
regardless of concentration, wide-band activity in the 0.1 - 10
Hz range with peak power frequencies at 1.0 - 2.2 Hz (1.31(0.09
Hz , 95% confidence limits). To show consistency, all observations
with typical responses are shown together (Fig. 4a). The pattern
of the peak power frequencies was virtually not influenced by
odor intensity. Notable was that the elevation of the 0.5 - 4
Hz activity was usually accompanied by a suppression of the 0.1
- 0.4 Hz activity (Fig. 1c, Panel 3). A typical example of the
response is presented in Figs. 1a-c. Activity increased most strongly
between 0.5 and 6 Hz with peak power at 1.5 Hz; another almost
equally prominent peak was at 0.7 Hz (Fig.1c, Panel 3, 5 min).
It remains to be investigated, however, whether or not this frequency
is the same as the robust spontaneous oscillation at 0.7 Hz reported
in Limax PC (25). Theta-rhythm (5-8 Hz) was elicited 9 min after
stimulus onset (Fig. 1b,c, Panels 4).
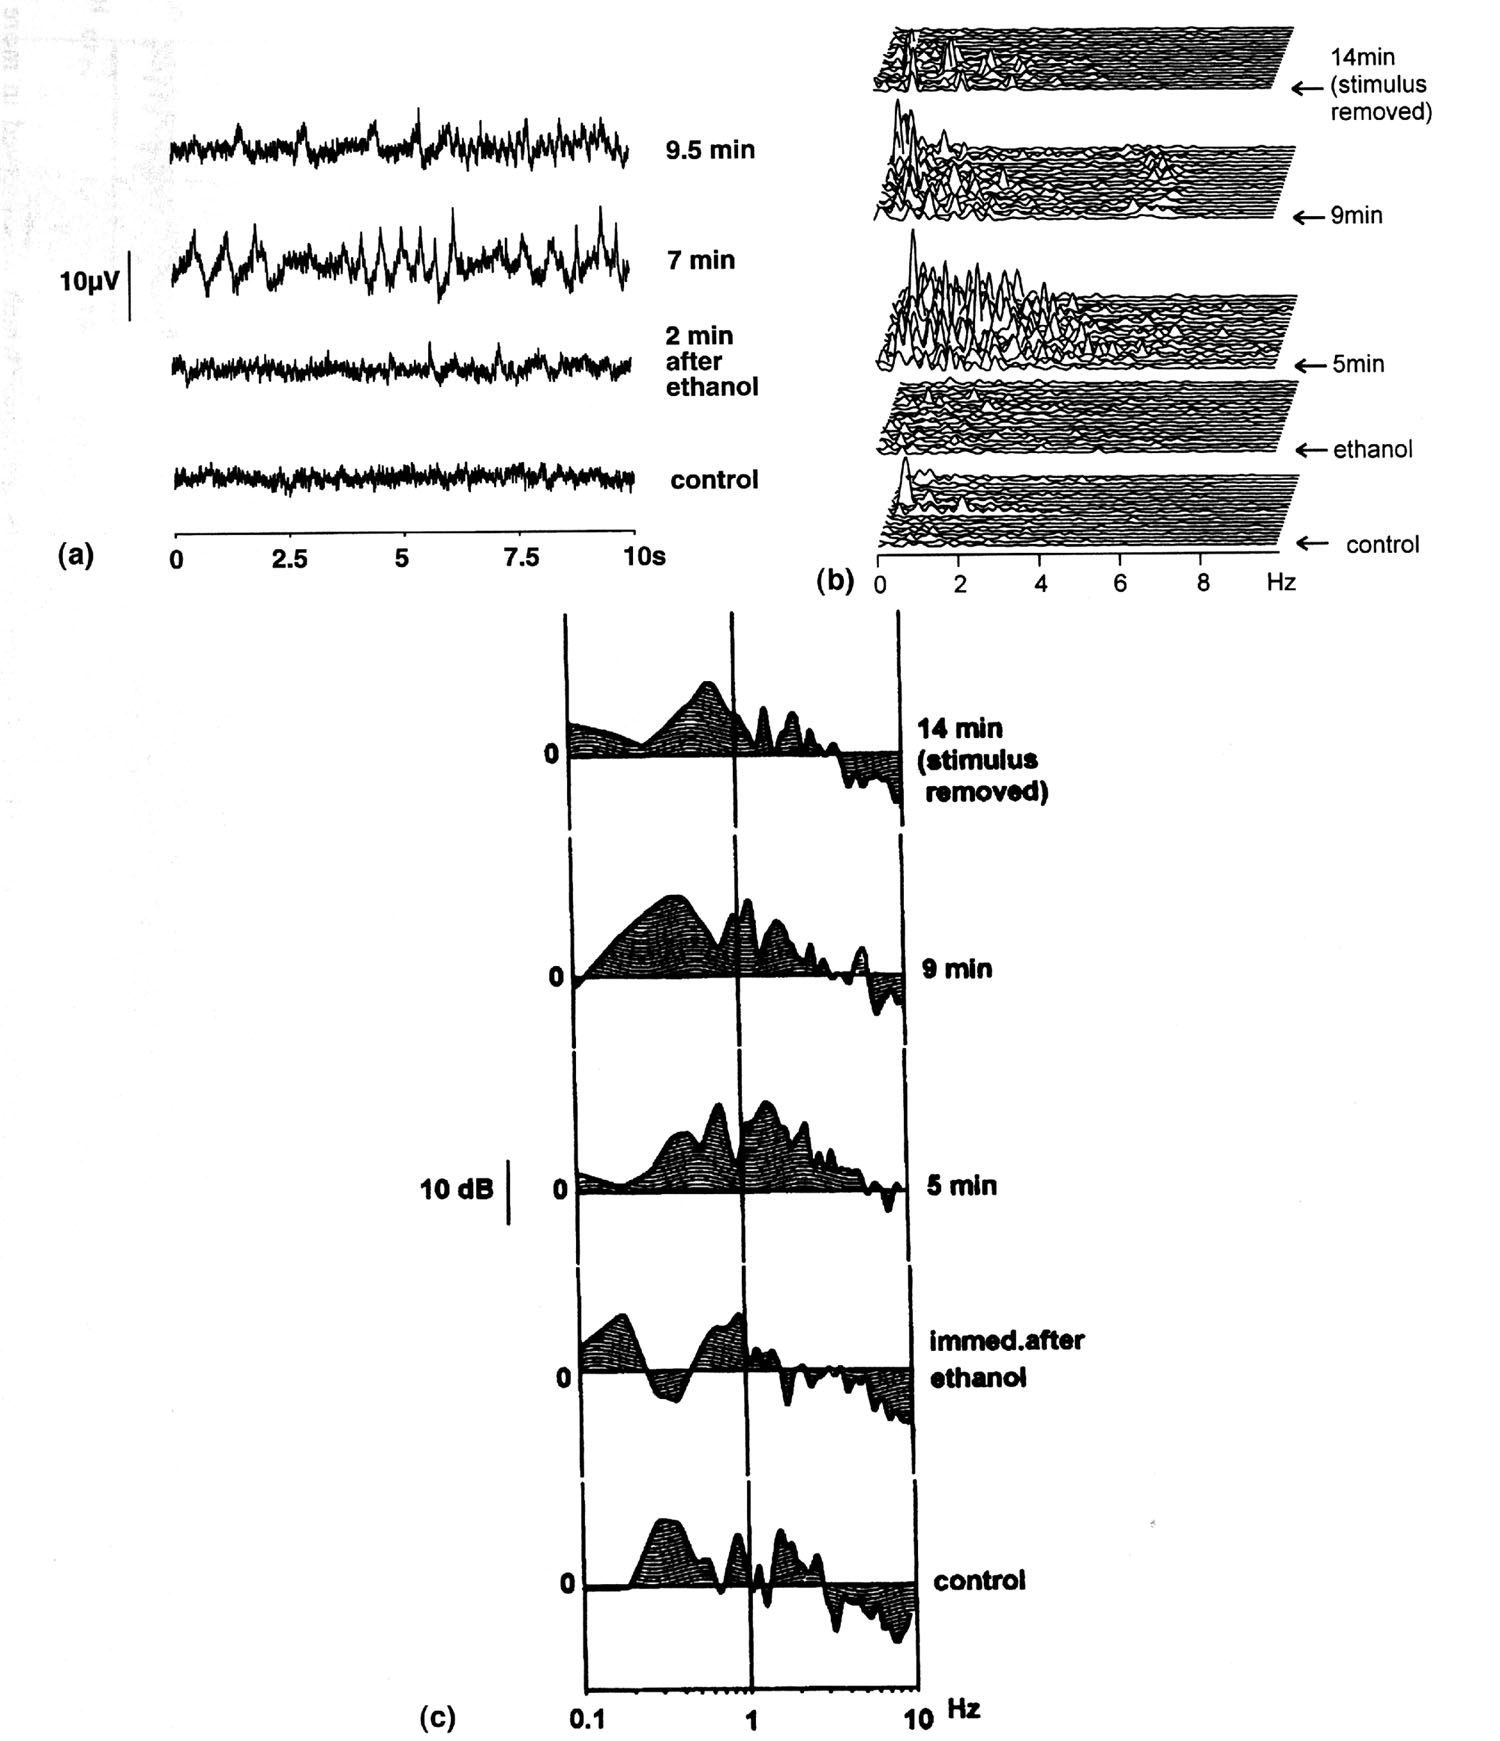 |
Fig. 1. Ethanol-induced response of the procerebrum (Preparation No. 88). This is a typical example of the response sequence which we observed in more than 50 % of the trials. (a) Time signals from an experiment, in which 0.5-5 Hz burst activity occurred. In each panel an epoch of 10 sec is shown. From bottom: control (before stimulus); ca. 2 min, ca. 6.5 min and 9 min after stimulus onset. A multi-peaked fluctuation occurred starting around 5 min with dominance around 1.5 Hz and elevation of amplitude. In a few minutes the pattern of activity changed shifting the dominant frequency to < 1 Hz and increasing activity around 6 Hz. (b) The corresponding power spectra of single epochs. From bottom: control (before stimulus), immediately, 5 min, 9 min and 14 min after stimulus onset (stimulus removed at 14 min). Burst activity, occurring in the 0.5-5 Hz range 5 min after stimulus, showed numerous frequency peaks that seemed to change positions in every epoch. The pattern of activity then changed in a few minutes shifting the frequency center to < 1 Hz and at the same time elevating activity around 6 Hz, and finally subsiding altogether. (c) The corresponding average FAPs. The order of presentation is the same as (b). Note that the FAP of the burst activity at 5 min after stimulus depicts 1.5 Hz as the dominant peak and 0.7 Hz as almost equally strong peak. The change of activity 9 min after stimulus onset was here again visible as the shift of dominance to < 1 Hz. |
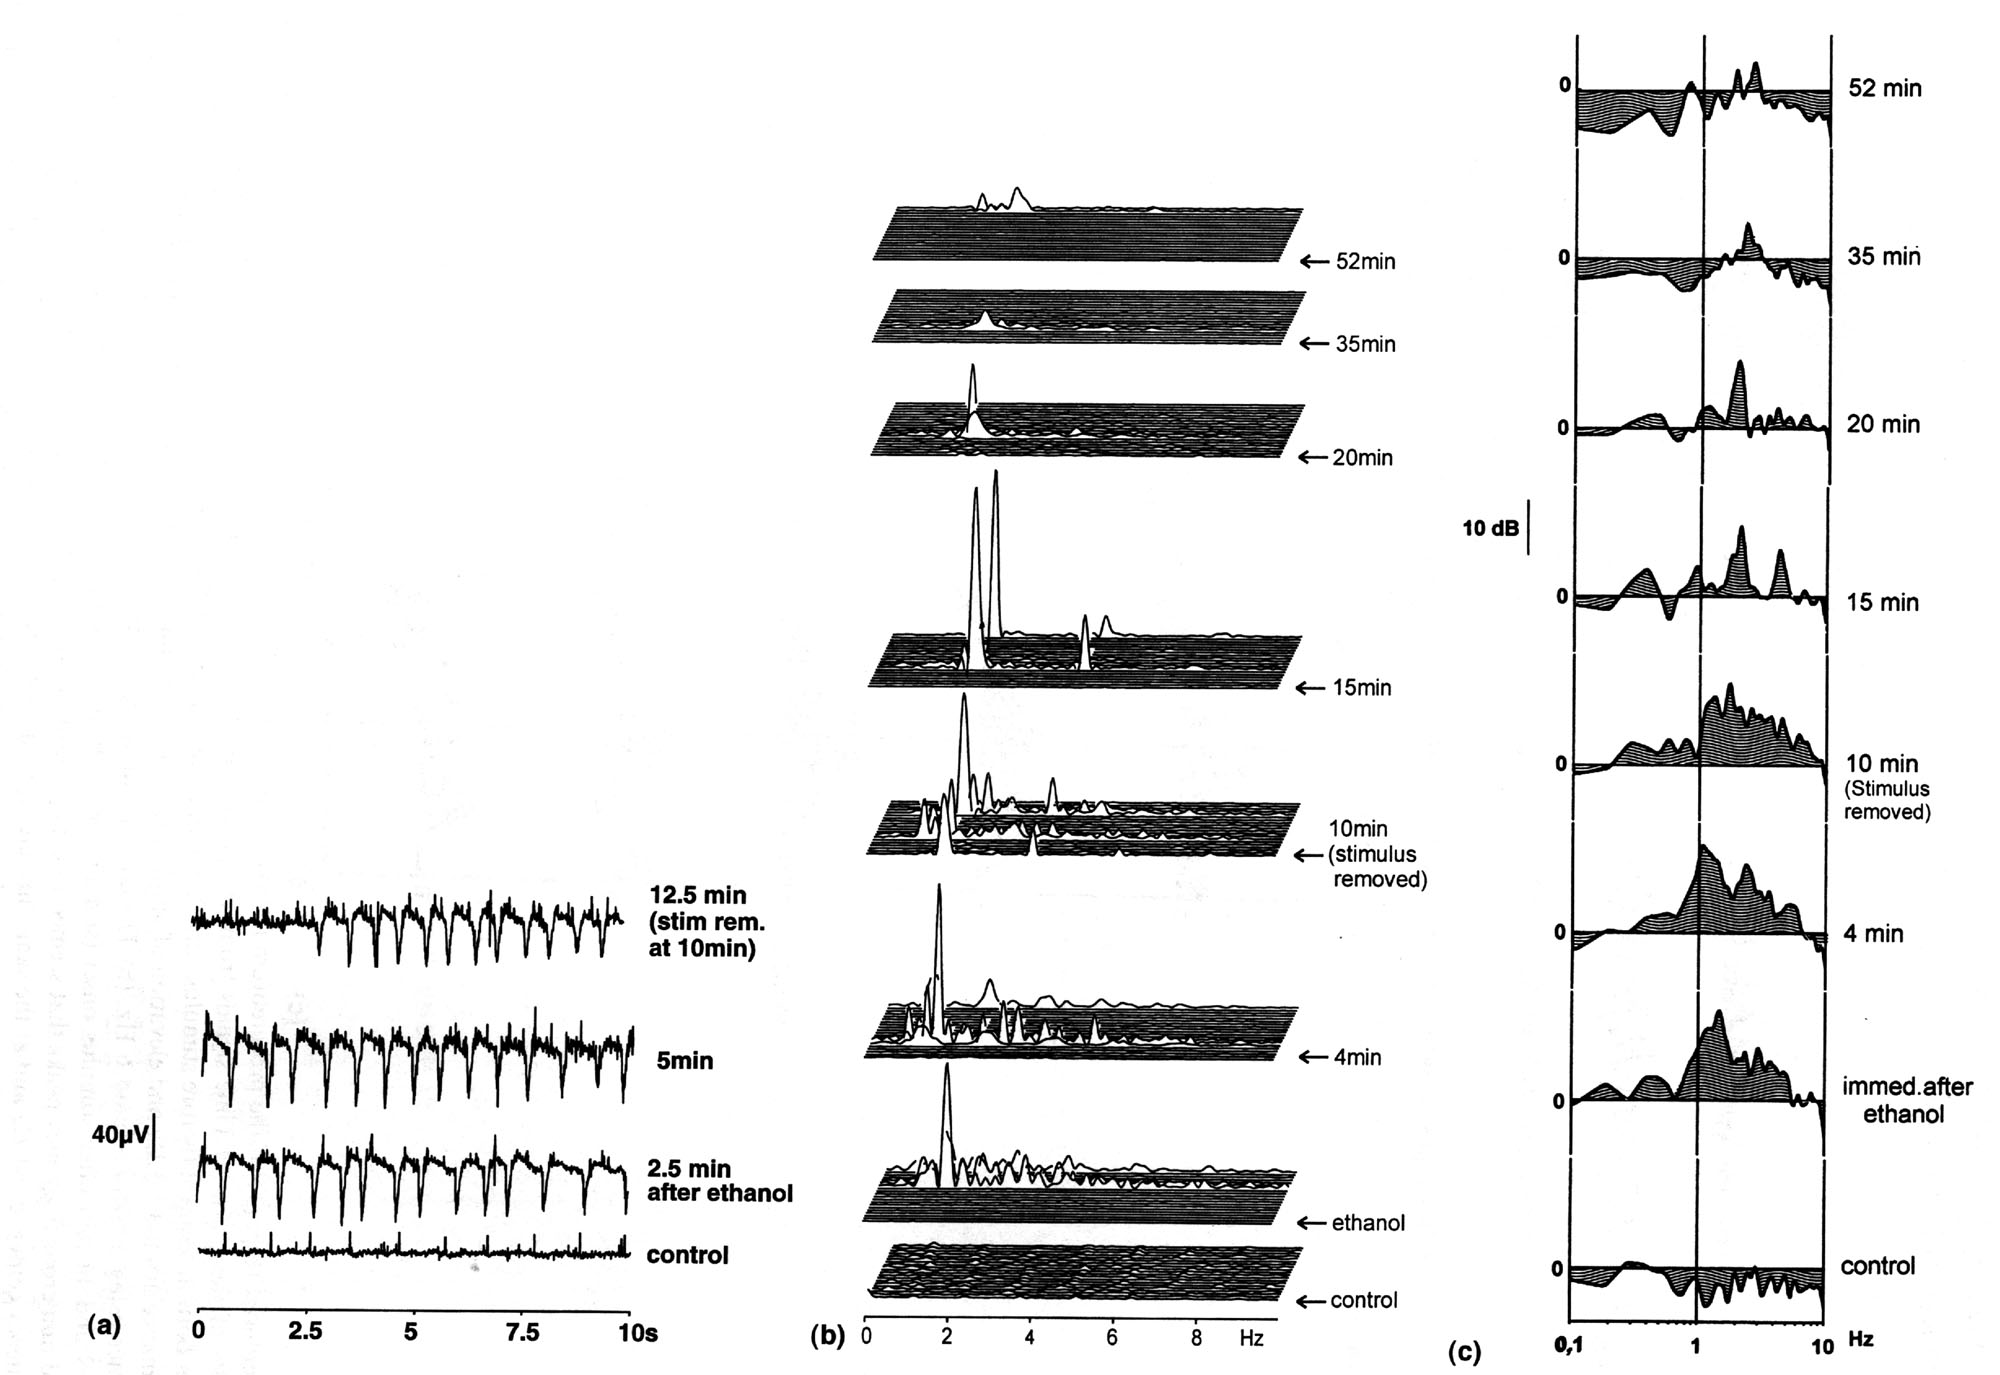 |
Fig. 2. Ethanol-induced response of the visceral ganglion. The same preparation (No. 88) as Fig. 1. This is a typical response sequence which we observed in more than 70% of the trials. (a) Time signals from an experiment where burst oscillation of 1.5 Hz was intermittently elicited. Each panel is an epoch of 10 sec. From bottom: control; (1) 2.5 min, (2) 5 min, (3) 12.5 min after stimulus onset (stimulus was removed at 10 min after stimulus onset); (b) The corresponding power spectra of single epochs. Burst activity with strongest power around 1.5 Hz was elicited in intervals for 15 min and lasted longer than 50 min with frequency shifting to 2 Hz and power decreased; (c) The corresponding average FAPs. Ethanol elevated the 0.6-6 Hz activity peaking around 1.5 Hz most strongly the first 15 min and then a relatively robust 2 Hz activity dominated the following 45 min. |
2-Butanol. This higher alcohol induced
a different response in the PC compared with ethanol and elevated
activity mainly in the frequency range < 8 Hz (occasionally
reaching 10-15 Hz) with the maximal peak at (0.7 Hz (0.67(0.03
Hz, 95% confidence limits) at all concentrations and in all preparations
(Tables 1and 4.). As with ethanol, diluted butanol seemed to cause
a decrease of amplitude in some cases.
2-pentanol (amyl alcohol). PC responded to this odorant with elevation
of a lower frequency range compared with either ethanol or 2-butanol,
i. e., < 4 Hz with power maximum at (0.5 Hz (0.48(0.04 Hz,
95% confidence limits; Tables 1 and 4). Amyl alcohol induced fluctuations
at all concentrations and in all preparations.
Formic acid. The frequency range of the induced activity lay below
5 Hz with peak power frequencies at 0.3-0.5 Hz (0.36 ( 0.03 Hz,
95% confidence limits) which seemed to be independent of the stimulus
concentration (Fig. 4b and Table 4). Typical records of the response
are shown in Fig. 3a. Note that a slow fluctuation occurred starting
at 1 min after stimulus onset bursting strongly at 10 min. The
early response of PC to formic acid was most evident in the increase
of power in the lower frequency range (< 0.7 Hz) with the peak
power at 0.4 Hz (Figs. 3a-c, Panels 2). The later response burst
(Fig. 3a-c, Panels 3) reached 10 Hz by its inctrease of power,
but the strongest increase took place in the range < 1.0 Hz
with maximal frequency at the same 0.4 Hz (Fig. 3c, Panel 3).
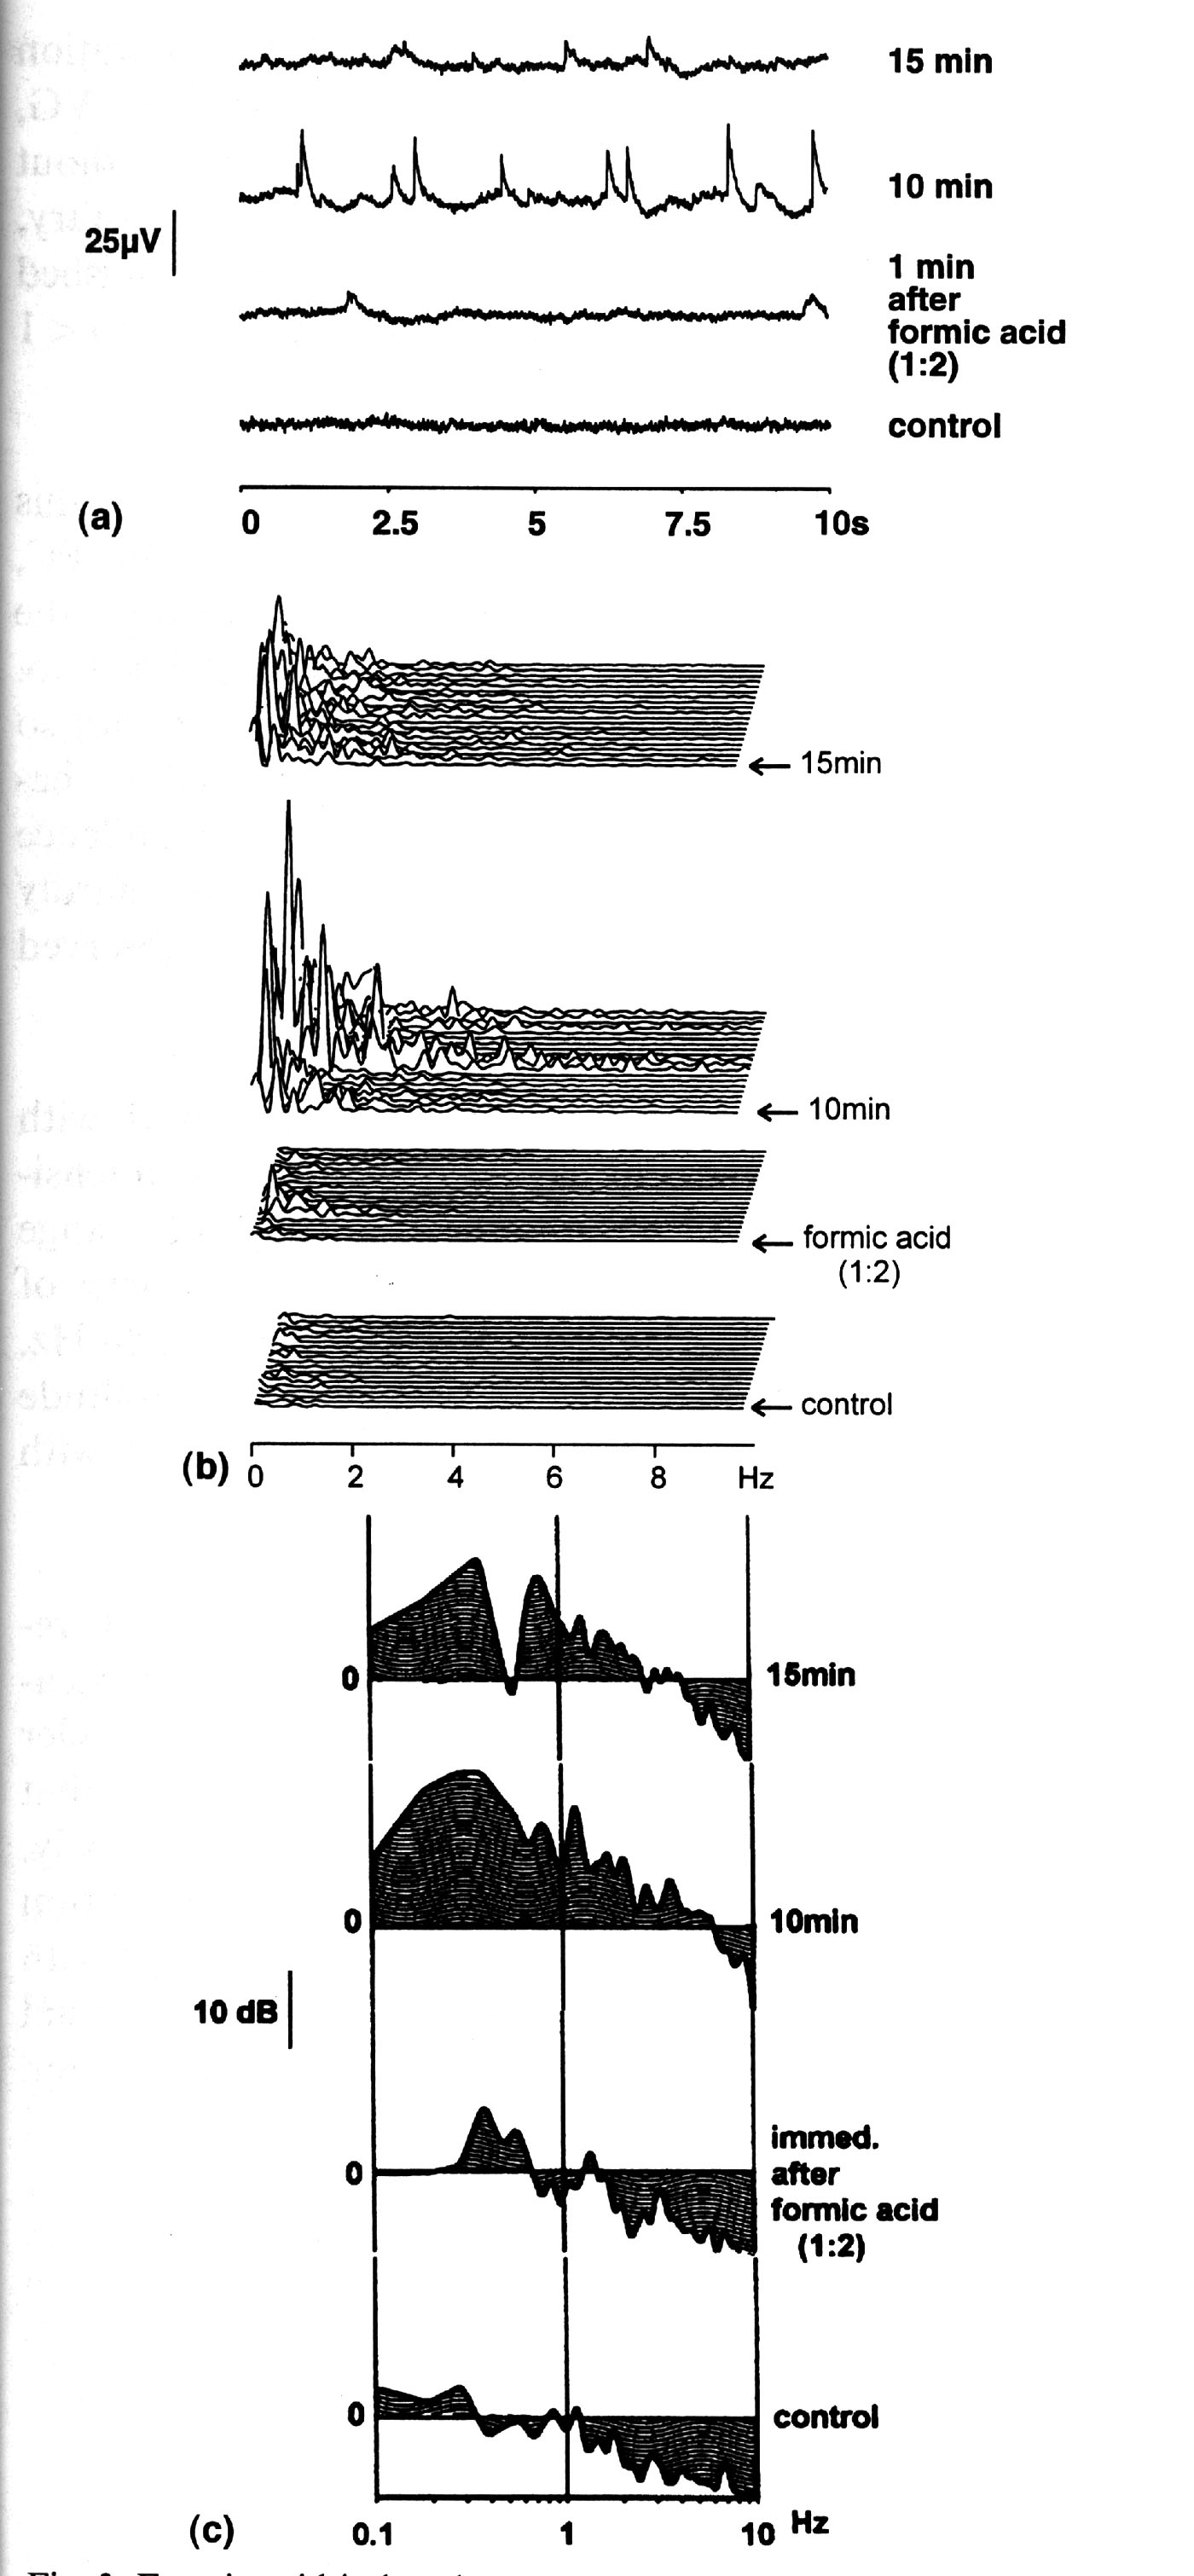 |
Fig. 3. Formic acid-induced response of the procerebrum. (a) Typical time signal of an epoch (10 sec.) From bottom: control; 1 min, 10 min and 15 min after stimulus onset. (b) The corresponding power spectra of single epochs. Burst activity with many sharp peaks occurred intermittently. (c) The corresponding average FAPs. Elevation of 0.4 Hz activity was clearly visible in the response. |
 |
Fig. 4. Induced field potential activities of the procerebrum at different odorant intensities. (a) Ethanol-induced response: the affected frequency range of an observation and its peak power frequency (( 1 Hz), marked on the horizontal line. In about 33% of observations, elevation of activity occurred at > 0.5 Hz; (b) Formic acid-induced response. Elevated activity went down to 0.1 Hz without exception, which was different from that of ethanol. Note that induced activities seldom reached beyond 15 Hz in both cases and that in 56% of ethanol-induced activities and in 24% of formic acid-induced activities the frequency range extended beyond 5 Hz. |
Ammonia. This chemical, found in nature
as a metabolic product, induced an activity which was conspicuous
in the following points. a) The frequency range of the response
varied widely from < 0.7 Hz to < 25 Hz depending on the
preparation and was, without exception, characterized by the maximal
peak at 0.2 ( < 0.02 Hz. b) Latency was always very short.
c) At all concentrations the induced 0.2 Hz activity decreased
within 20 to 30 seconds. But in spite of the adaptation, the response
activity in the other frequency range lasted longer than 10 min
Onion. In all preparations procerebral response occurred immediately,
but largely in frequency. When freshly obtained onion juice was
applied to the tentacle, activity below 1 Hz was enhanced with
average FAPs depicting elevation of power between 0.2 and 0.6
Hz (0.36 ( 0.14 Hz, 95% confidence limits; Tables 1 and 4). It
is noteworthy that this onion-induced peak power frequency was
very similar to that of formic acid, though the former was less
aversive than the latter (Table 3).
Apple. This fruit is strongly favoured by the snail as food and
stimulation with the fresh juice accordingly induced different
response from onion (Tables 1, 3 and 4).: immediate elevation
of activity took place mainly in the 0.3-4 Hz band with the peak
power frequencies varying between 0.9 and 1.3 Hz (1.10 ( 0.25
Hz, 95% confidence limits). Both apple and ethanol (( 25%), attractive
to the snail (cf. Locomotion behavior), notably had peak power
frequencies > 1 Hz.
Visceral ganglion
Activity in the absence of odorIntrinsic activity of VG was more
spiky (Fig. 2a, bottom) than PC (Fig. 1a, bottom). It depended
on the preparation and exact placement of the electrodes, but
the activity was most often with a moderate amount of spiking
(a power peak below 10 Hz) and, occasionally with a high amount
of bursts (one peak at < 50 Hz and another between 50 and 150
Hz) (Schuett et al., 1992; Schuett and Ba-ar, 1992). Under the
present digitization, the power of the activity of VG extended
to at least up to 50 Hz and was higher than that of the PC lobe.
This was also evident in the RMS-voltages: in the 0.5-15 Hz band,
RMS-voltage of VG was 2.6 - 9.1 V (that of PC was 1.5 - 7.0 V);
in the 15 - 50 Hz band, RMS-voltage of VG was 2.7-8.1 V (that
of PC was 0.7-1.0 V).
Odorant-induced activity
VG controls the digestive as well as sexual organs and is certainly
expected to be involved in olfactory information processing. Although
the neuronal pathway from PC to VG is not known, odor input markedly
altered activity. The responses of the VG shared similarity with
those of PC in frequency. The results are summarized in Table
2. We state some notable features of the responses in the following.
|
|
Table 2. Odorant-induced field potential activities in the Helix visceral ganglion. a) Number of all preparations tested; b) Number of all trials made with all the preparations ; c) Number of preparations and d) number of trials made with the preparations, in which particular responses were elicited. Definitions of peak power frequency (Hz) and range (Hz) are the same as Table 1. Immediate response occurred mainly in frequency and much less in RMS-amplitude (0.5-15 Hz; for ammonia at 0.1-15 Hz)) in VG except with undiluted ethanol and ammonia. Peak power frequencies of responses in VG were very similar to those in PC. Note that %change of RMS-amplitude (0.5-15 Hz) hardly showed any dose dependency. |
Ethanol. Olfactory stimulation with
ethanol evoked strong FP fluctuations which were characterized
by frequency peaking at 1.0 - 2.3 Hz (1.60(0.08 Hz, 95% confidence
limits; Tables 2 and 4). Typical records from one experiment are
shown in Fig. 2a. Ethanol elicited burst activity enhancing nearly
the same frequency component as that in PC lobe of the same preparation
(cf. Figs. 1a-c and Figs.2a-c), but with higher power at ( 2 Hz.
These intermittent bursts some minutes apart are largely due to
quite regular spike discharges of a single unit or a synchronized
group of them. Any periodicity in the response was not maintained
for long. The typical voltage vs. time records of the response
(Fig. 2a, Panels 2-4) also clearly depict these frequency components.
It is noteworthy that the (2 Hz activity occurred intermittently
for as long as 52 min in this particular preparation decreasing
its power with time. Interestingly, in VG, this induced ( 2 Hz
fluctuation lasted long without shifting the frequency to below
1 Hz. On the contrary, in PC, the ethanol-induced activity either
diminished after 10-15 min or shifted the frequency center to
< 1 Hz.
2-Butanol. The responses induced in VG by this higher alcohol
were not so conspicuous as in PC, differing in the following respects.
i)The stronger the intensity, the higher the frequency range extended
to. ii) The peak power frequencies of response were not so strongly
consistent as in PC, fluctuating slightly between 0.3 and 0.9
Hz (0.65(0.07 Hz, 95% confidence limits; Table 4). iii) Response
in amplitude hardly depicted a possible dose dependency, such
as observed in PC.
2-Pentanol (amyl alcohol). As observed with ethanol or 2-butanol,
the stronger the stimulus intensities (undiluted and 1:8), the
higher the frequency range of the induced activities. The peak
power frequencies of the response activities were 0.4-0.7 Hz (0.43(0.08
Hz, 95% confidence limits; Table 4). Response in amplitude appeared
to be less conspicuous in VG compared with PC.
Formic acid. Spectral analyses depicted responses with peak power
mainly at 0.4 Hz, but occasionally at 1.5 - 2.5 Hz. The response
had smaller increase of the < 0.5 Hz component compared with
that of PC and varied more intra- and inter-individually. The
immediate response took place mainly in alteration of frequency
and did not appear to be correlated with odorant intensities.
The induced activity with maximal peak at 0.4 Hz, for instance,
lasted at least for 5 min and sometimes longer than 20 min (Table
2).
Ammonia. This odorant induced strong responses in VG and their
patterns were partly similar to those in PC. Elevation of power
occurred over a wide frequency range extending from 0.1 up to
at least 50 Hz, but most strongly < 1 Hz. The most prominent
frequency of the response was 0.2 ( < 0.02 Hz (Table 4). The
response occurred always immediately after stimulus onset. Interestingly,
the 0.2 Hz activity of VG lasted much longer (5-10 min) than that
of PC (20 - 30 sec) although the other frequency components lasted
much longer.
We may conclude from these findings: a) Each odorant induced,
in the low frequency range, characteristic, wideband FP activities
in the < 15 Hz band. The peak power frequencies, which lay
below 2.5 Hz, seemed to be constant regardless of preparations
and intensities and hence may be specific for the odorant. b)
Peak power frequencies induced in PC and those induced in VG were
either the same or very similar, but the amplitude of the <
15 Hz band was smaller in PC than that in VG.
Behavioral response
Locomotion behavior
To examine attractiveness of etanol and apple, we performed experiments
with two active snails by observing locomotion behavior. We presented
an active snail a piece of filter paper soaked with 25% ethanol
at a distance of 6 cm from the tentacles. The snail steadily crawled
towards the odor source and remained, for at least 5 min, at such
a position that the extended tentacles were within 1 mm reach
of the odorant. This result suggested that the snail was attracted
by 25% ethanol. Undiluted ethanol was, however, repellent to the
snail to a certain degree: it reacted with the tentacle withdrawal
reflex at a distance of 1.0 ( 0.5 cm or with a latency of 6 (
0.9 sec (Tab. 3). In another similar experiment with a piece of
fresh apple, it was shown that the snail was strongly attracted
by the fruit moving steadily forward with the tentacles extended
and chewed on it for a long time.
Degree of aversion
To see how differently the snail reacts to each odorant, we also
estimated the degree of aversion for each odorant, with visible
withdrawal of the tentacles as parameter, in two different ways:
distance and latency. For this purpose we used a number of active
snails that were later submitted to the in vitro experiments.
The results are shown in Table 3. The snail senses ammonia (1%)
as the most aversive of all odorants tested, withdrawing the tentacles
at the longest distance of 8.5 (1.0 cm (confidence limits) or
at the shortest latency of < 1 sec and ethanol as the least
aversive, at the shortest distance of 1.0 ( 0.5 cm or the longest
latency of 6.1 ( 0.9 sec (95% confidence limits). The parameters
measured in distance seemed to be linearly related to those in
latency. Based on these parameters the order of aversiveness can
be described as follows: 1% ammonia > formic acid > 2-pentanol
> butanol > ethanol.
|
|
Table 3. Degree of behavioral aversion determined in different parameters. The values of stimulus-tentacle distances and latencies are means ( 95% confidence limits. a: number of snails ; b: number of trials. * When ethanol was diluted to 1:4, the snail did not withdraw the tentacles at the distance of 1 mm at least for 5 min. **The snail continuously sensed the odor source with the tentacles stretched to the touching distance. Note that the degree of aversion estimated in stimulus-tentacle-distance appeared to be linearly related to that estimated in latency, in spite of estimates by eye and manual treatment of odor source. |
A point of some interest, comparing
our findings with the paper of Ohloff (1986), is that the order
of aversiveness of the five pure chemicals tested here, behaviorally,
seems to correspond to that expected from consideration of the
molecular properties of these chemicals that lead to adhesion
of the molecules to the receptor cell membrane.
Relationship between degree of aversion and odorant-induced frequencyTo
examine if there was any correlation between the behavioral valence
of an odorant and the odorant-specific peak power frequency, the
degree of aversiveness in distance was semilogarithmically plotted
against the peak power frequency (Hz) of the induced FP activity
in the isolated PC lobe as well as VG (Fig. 5a,b). There was evidently
a linear relationship between them. This may suggest that there
is some correlation between the most dominant low frequency component
of the characteristic FP response and behavior, i. e., the chemical
nature of the odorant: the lower the induced peak power frequency,
the more aversive the odorant. Furthermore, these most prominent
frequencies may be considered to be odor-specific, since they
are invariably observed regardless of intensities and preparations.
|
|
Table 4. Relationship between degree of aversion and peak power frequency of odor-induced field potential activity in the Helix procerebrum and visceral ganglion. Degree of aversion is expressed as stimulus-tentacle distance at withdrawal reaction. Number of observations, right, and that of preparations, left, in brackets. In these observations the criteria chosen for power maximization were: for ethanol ( 1 Hz; for other odorants < 1 Hz. All values are presented as means ( ( 95% confidence limits for the means ( calculated according to (Student( and accompanied by number of snails or preparations, left, and number of observations, right, in brackets. These results are also shown in Fig. 5. |
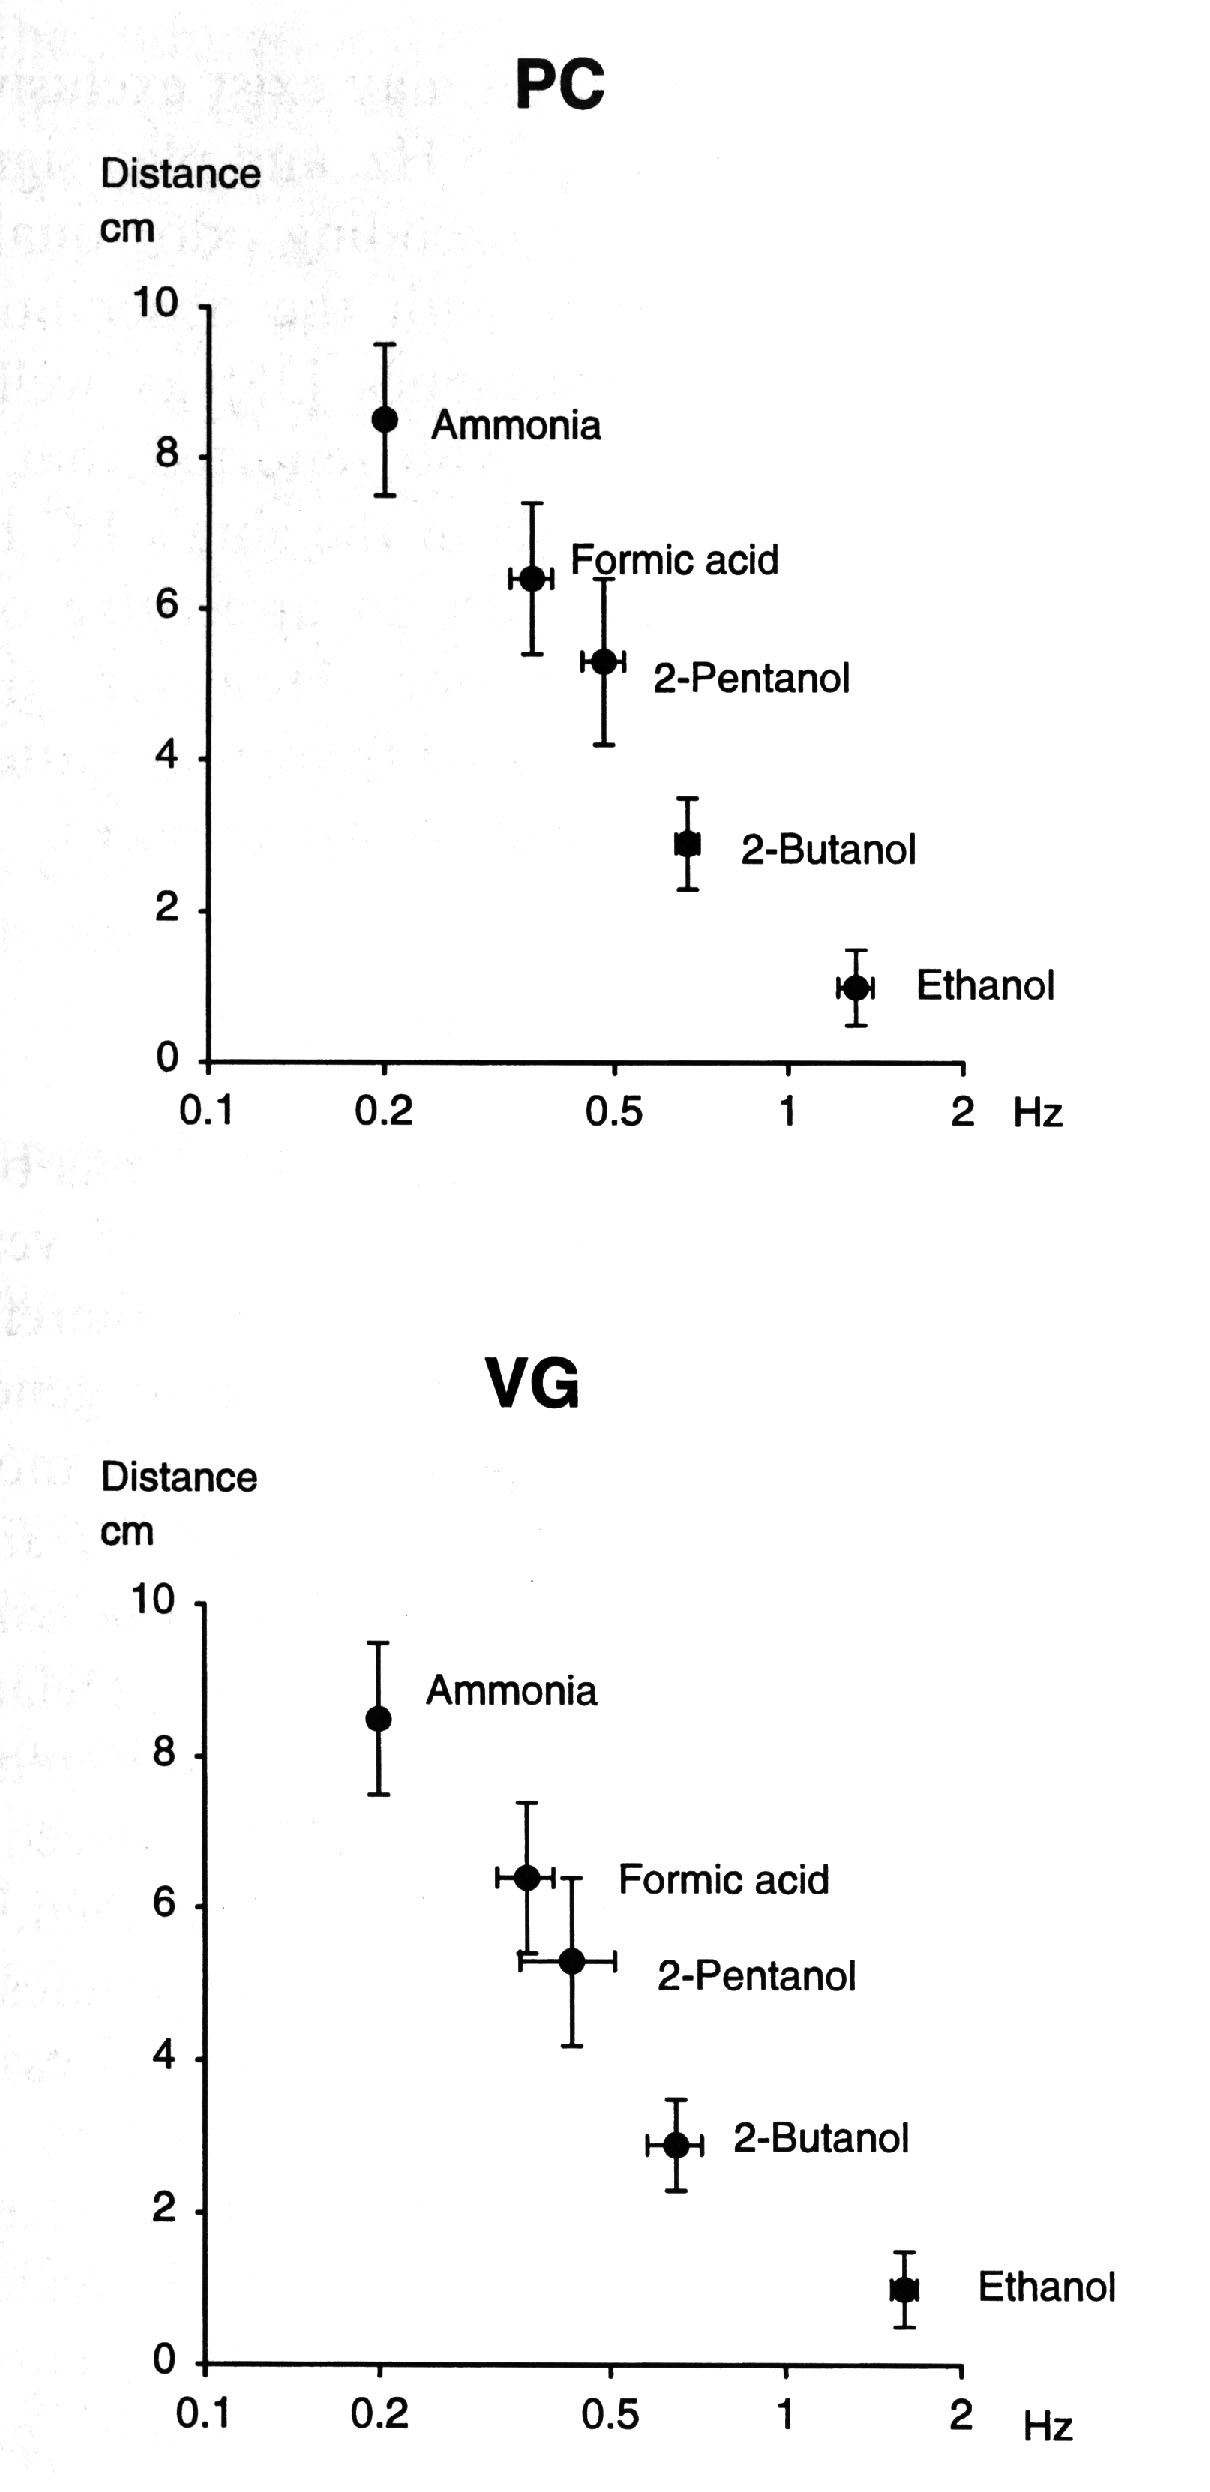 |
Fig. 5. Relationship between degree of aversion and frequency of odorant-induced activity. The bars represent 95% confidence limits for the means. Numerical values are also presented in Table 4. Note that there was a linear relationship between degree of aversiveness and peak power frequency of odorant-induced FP activity in the Helix procerebrum and visceral ganglion. This diagram suggests: (a) order of aversiveness appears to reflect that of molecular affinity: the stronger in affinity an odorant, the more aversive it is to the snail; (b) order of affinity is correlated to peak power frequency of induced FP: the stronger in affinity an odorant, the lower the odorant-induced frequency.; (c ) the more aversive an odorant, the lower the peak power frequency; (d) extrapolation of the curve to the abcissa yields a value of ( 2.5 Hz. This is the area for an appetitive odorant (ethanol) for the snail. These curves suggest that the odorant-specific frequencies may, together with other frequency components, be involved in identification, classification and discrimination of odorants or their classes and that the most crutial FP activities relevant for this function may exist below (2.5 Hz. |
|
|
Discussion |
|
|
|---|
We used semimicroelectrodes for recording electrical activity
and analyzed intrinsic as well as odorant-induced fluctuations
by power spectra. This approach allowed us to describe and characterize
changes of activity in frequency and amplitude, and relate them
to specific odorants. We could also correlate these changes to
behavior.
Odor-specific responses of the ganglia
Both PC and VG responded to each of the odorants tested here specifically
in frequency, but PC also in amplitude (the < 15 Hz band) exhibiting
diffuse dose-dependencies. Interestingly, the curve of this dose
dependency appeared different for each odorant indicating a distinct
sensitivity. This may suggest that, in PC, odor input is processed
not only in frequency, but in amplitude as well. Response in amplitude
may also be related to odor quality and, in part, to odor intensity.
Notably, in VG, no dose-relatedness was observed. It is still
to be studied whether or not this is due to weak coupling between
PC and VG, as observed between pedal cells and PC (Gelperin and
Flores 1997).
A number of studies with invertebrates (Derby and Ache, 1984;
Giradot and Derby, 1988; 1990; Gelperin and Tank 1990; Gelperin
A 1994; Gelperin et al. 1996; Gelperin et al. 1993; Kimura et
al., 1993; Kleinfeld et al. 1994; Kuettner et al. 1995; Laurent
and Davidowitz 1994; Schuett and Ba-ar 1994; Cinelli et al. 1995;
Gervais et al., 1996; Laurent et al., 1996; MacLeod and Laurent,
1996; Gelperin and Flores 1997) have shown that odor information
brings neurons of the olfactory neuronal circuit into increased
FP fluctuation by spatio-temporal organization of neuronal assemblies
and predicted that this induced/evoked activity may strongly be
related to the mechanism of odor encoding in general. Our findings
also strongly support this idea evidencing odor-induced frequency
patterns that are specific to odorants tested in the present study.
Odor-nonspecific responses of the ganglia
Activities in the >15 Hz were seen regularly in the VG, but
only occasionally in PC. In VG, the FPs in this band were enhanced
by ethanol and ammonia and, in some experiments, by formic acid
and 2-pentanol. In PC undiluted ethanol and dilutions of formic
acid and 2-butabol induced fluctuations in this band. The RMS-voltages
of, for examples, the 15-30 Hz and 30-50 Hz bands increased and
this may suggest that these frequency bands are also involved
in processing of odor information. One other important response
activity to be mentioned is that of the 3-20 Hz range, especially
the activities in the 3-7 Hz band. In this case, a power peak
between 3 and 7 Hz, weaker but relatively consistent, appeared
over several epochs: in PC mainly by stimulation with ethanol
and, in one case, with 2-pentanol and in VG by administration
of all five odorants.
When there was a response in the > 15 Hz band, the activity
in the 3-15 Hz band also normally increased. Whether or not there
is some correlation between these frequencies remains still to
be answered. In one preparation we observed a conspicuous fluctuation
in the 6-20 Hz band lasting over several epochs with a power maximum
at 10 Hz. Interestingly, odorant-nonspecific 7-13 Hz FP oscillations
have also been observed in the frog olfactory bulb (Delaney and
Hall 1996). These apparently odorant-nonspecific frequencies seem
to exist in a variety of species, but the functional meaning of
each of these frequencies is not yet known.
Odorant-evoked 20 Hz local field potential oscillations (Laurent
and Davidowitz 1994; Delaney and Hall 1996) and 40 Hz- (gamma-)
activity (Eckert and Schmidt 1985; Freeman and Skarda 1985; Bressler
and Freeman 1980) have been reported, but the nature of these
high frequency activities appears to be, more or less, odorant-nonspecific.
The gamma-activty, for instance, is evoked in different species,
including the Helix, with a variety of stimulus modalities (Ba-ar
et al. 1999; Schuett et al. 1999). Interestingly, we observed,
in some preparations, similar nonspecific > 15 Hz activities
where increases of the RMS-voltages in the 15-30 Hz and 30-50
Hz bands were evident. We also consider these high frequency activities
to be involved, together with the other frequencies, in olfactory
information processing, as hypothesized by the others.
Other features of the ganglional responses
There are several other features to be noted: a) In many cases
the activity first subsided for one to several minutes after stimulus
onset over a wide range of frequency with waves or spikes totally
disappearing (0.1- > 15 Hz; Figs 1b and 2b, Panel 2) and then
became suddenly bursting. This phenomenon may be due to reorganization
of cellular activity before coming to a frequency tuning. b) The
power often increased with time during stimulation (Figs. 2b-c
and 3b-c) and then subsided probably due to adaptation. In some
preparations, however, removal of an odor coincided with sudden
increase of the potentials in the < 15 Hz band. It is still
to be investigated whether the enhancement of the potentials was
due to an OFF effect or related to some other function. c) Another
interesting aspect is that there was a large difference in the
duration of the odor-specific activity of ethanol between PC and
VG: In VG, a characteristic bursting occurred intemittently for
a long time (Figs. 2b and 2c) while in PC it either subsided in
a few minutes or continued shifting the frequency center to <
1 Hz. This intermittent activation of VG at ( 2 Hz, for instance,
may be related to specific memory function of this ganglion.
Propagation of activity
Although the recordings from PC and VG were not carried out simultaneously,
our findings suggest that the activity patterns evoked in PC apparently
propagate to VG. VG is known to control functions of digestive
and sexual organs, both of which may be activated by input of
attractive or repellent odors. Although the neuronal pathways
to VG are still unidentified, cells are known in the ganglion
in Helix that respond to chemical stimulation with quinine - e.g.
serotonergic giant parietal neurons. The origin of this response
is assumed to be in PC cells (Zakharov et al.1995). Since the
parietal ganglia have connections to VG, olfactory signals could
propagate from PC to VG through the parietal ganglia.
Our most recent experiments with the Helix pedal ganglion (PG)
(Schuett, Bullock and Ba-ar 1999) showed that in this center of
locomotion odor input evoked responses similar to those observed
in VG. The pedal cells with dendrites in the PC lobe are very
likely to carry outputs from PC to PG, based on studies in Achatina
(Chase and Tolloczko 1989). Our preliminary study with simultaneous
recordings from PC and PG showed that responses with the same
odorant-specific frequencies were elicited in these ganglia (unpublished
data). Further study in this direction would add tests of our
hypothesis.
Moreover, it has recently been reported that the spontaneous action
potentials of cells in the Limax PG are weakly coupled to the
local field potential oscillation in the PC lobe (Gelperin and
Froles 1997). The mechanism of the signal transfer from PC to
VG or PC to PG that we observed may be explained by such a coupling.
Relation to behavioral valence of odolant
Although our estimates of behavioral valences of the odorants
were based on observation by eye and manual movement of odor source,
the parameters thus obtained were linearly correlated to the odor-specific
frequencies. There seem to be strong correlations among chemical
nature of an odorant, odor-specific peak power frequency and behavior.
In other words: (a) The stronger the chemical affinity, the more
aversive to the snail. (b) The stronger the chemical affinity,
the lower the odor-specific frequency. (c) The more aversive the
odor is to the snail, the lower the odor-specific frequency of
induced FP activity. (d) Sensitivity manifested as rate of RMS-amplitude
increase of the low frequency range (<15 Hz) may also be related
to odor quality and, in part, to odor concentration. (e) Extrapolation
of the curves in Fig. 5 strongly suggests that the behaviorally
relevant frequencies may exist exclusively in the low frequency
range of < 2.5 Hz, and play significant roles in the mechanism
of encoding odor quality.
Our results seemed to agree with the observations made by Kimura
and his colleagues (1993) as well as Gervais and his colleagues
(1996) who reported that the frequency of local field potentials
in the slug's PC lobe was increased by stimulation with an appetitive
odor and decreased by an aversive one. However, these authors
could not relate the changed frequency patterns to specific odors
or to their behavioral valences.
Relevance for comparative studies
The olfactory system of terrestrial molluscs has been described
as fundamentally similar to that of vertebrates in its anatomical
architecture and may therefore be heuristic for studying olfactory
function in general (Chase and Tolloczko 1993). The findings from
the present species as a model may possibly be interpreted as
representative of some general phenomena of olfactory information
processing. Concerning the relevance of the isolated brain, Delaney
et al. (1996) demonstrated that there are no differences in odorant
induced local field potentials between in vitro and in vivo preparations.
Bullock (1945) claimed, for his material and criteria, that (the
activity manifested by the completely isolated brain or ganglion
is essentially the same as that in the intact animal in the intervals
between gross movement and in the absence of obvious stimulation.(
Our preparations were equivalent.
Recently, a number of reports on chemosensory evoked or event-related
potentials in mammals have appeared (Klemm et al. 1992; Sawada
et al. 1992; Van Toller et al. 1993; Brauchli et al. 1995; Hummel
et al. 1995; Lorig, et al. 1995; 1996). Some of them report increase
of theta and/or alpha activity in EEG during odor application.
However, correlation of these olfactory rhythms to specific odors
has not yet been established and similarities with the same parts
of the spectrum in Helix can not yet be asserted with any confidence.
Regarding delta (0.5-3.5 Hz) oscillations induced in the mammalian
brain, known are those which are universally evoked by a variety
of non-olfactory, cognitive inputs (Ba-ar et al. 1984; Ba-ar-Eroglu
et al. 1993; Parnefjord and Ba-ar 1995; Schuermann et al. 1995;
Ba-ar et al. 1996; Ba-ar 1998a,b). The possibilities of comparable
meanings or mechanisms represent a challenging agenda for comparative
studies.
Conclusion
Slow (< 1Hz) spontaneous fluctuations exist in the Helix brain
as wideband, nonrhythmic FP activity. Olfactory input modulates
these fluctuations presumably bringing neurons to synchronous
activities eliciting bursts, with characteristic frequencies and
amplitudes possibly specific to certain odors of the limited number
of odorants tested here.
The induced activities >5 Hz are probably odorant non-specific.
Peak power frequencies induced in PC and those induced in VG are
either the same or very similar and this may mean that olfactory
signals processed in the PC propagate further to VG.
These odorant-specific frequencies, that are also correlated to
behavioral output and exist exclusively in the low frequency range
of < 2.5 Hz, may play significant roles in the mechanism of
encoding odor quality. These odor-specific low frequencies in
combination with the other frequencies may function as identification
codes for the odorants or the classes of odors they each represent.
Acknowledgements
We thank Alan Gelperin, Bell Labs Innovations, Lucent Technologies,
N. J., U. S. A., for important suggestions in initiating this
work, Ronald Chase of McGill University, Montreal, Canada, and
David Kleinfeld of University of California, San Diego, Calif.,
U. S. A., for helpful discussions. The authors also thank Martin
Schuermann for valuable discussion, Ferdinand Greitschus for developing
softwares, Martin Gehrmann and Gabriele Huck for technical assistance
and Gabriela Fletschinger for preparing graphics. This work was
supported by DFG grants Ba 831/11-1/2.
|
|
References |
|
|
|---|
1. Adrian ED. Olfactory reactions
in the brain of the hedgehog. J. Physiol. Lond. 1942;199:459-
473.
2. Balaban PM and Maksimova OA. Positive and negative brain zones
in the snail. Eur. J. Neurosci. 1993;5: 768-774.
3. Ba-ar E. EEG-Brain Dynamics. Relation between EEG and brain
evoked potentials. Amsterdam: Elsevier, 1980.
4. Ba-ar E. Brain Oscillations: Principles and Approaches. Berlin
Heidelberg New York : Springer, 1999.
5. Ba-ar E. Integrative Brain Function: Neurophysiology and Cognitive
Processes Based on EEG Oscillations. Berlin Heidelberg New York:
Springer, 1999.
6. Ba-ar E, Schuermann M and Ba-ar-Eroglu C. Potentials, rhythmic
slow, behavioral correlates. In: Adelman G and Smith B, editors.
Encyclopedia of Neuroscience. Boston: Birkh"user , 1996.
7. Ba-ar E, Ba-ar-Eroglu C, Rosen B and Schuett A. A new approach
to endogenous event-related potentials in man: Relation between
EEG and P300-wave. Intern. J. Neuroscience. 1984; 24: 1-21.
8. Ba-ar-Eroglu C and Ba-ar E. A compound P-300-40 Hz response
of the cat hippocampus. Int. J. Neurosci. 1991; 60: 227-237.
9. Ba-ar-Eroglu C, Strueber D, Stadler M, Kruse P and Ba-ar E.
Multistable visual perception induces a slow positive wave. Intern.
J. Neurosci. 1993; 73: 139-151.
10. Ba-ar E, Schuett A and Bullock TH. Dynamics of potentials
from the brain of anamniotes. In Ba-ar E. Brain function and oscillations.
Vol. II. Integrative brain Function. Neurophysiology and cognitive
processes. Berlin Heidelberg New York: Springer, 1999: 109-116.
11. Brauchli P, Rueegg PB, Etzweiler F and Zeier H. Electrocortical
and autonomic alteration by administration of a pleasant and an
unpleasant odor. Chem. Senses 1995; 20: 505-515.
12. Bressler SL and Freeman WJ. Frequency analysis of olfactory
system EEG in cat, rabbit and rat. Electroencephalogr. Clin. Neurophysiol.1980;
50: 19-24.
13. Bullock TH. Problems in the comparative study of brain waves.
Yale J. Biol. & Med. 1945;17: 657-679.
14. Bullock TH. Introduction to induced rhythms: A widespread,
heterogeneous class of oscillations. In: Ba-ar E and Bullock TH,
editors. Induced rhythms in the brain. Boston, MA: Birkh"user,
1992: 1-26.
15. Bullock TH and Ba-ar E. Comparison of ongoing compound field
potentials in the brains of invertebrates andd vertebrates. Brain
Research Reviews 1988;13: 57-75.
16. Chase R and Tolloczko B. Interganglionic dendrites constitute
an output pathway from the procerebrum of the snail Achatina fulica.
J. Comp. Neurol. 1989, 283: 143-152.
17. Chase R and Tolloczko B. Tracing neural pathways in snail
olfaction: From the tip of the tentacles to the brain and beyond.
Microscopy Research and Technique 1993;24:214-230.
18. Cinelli AR, Hamilton KA and Kauer JS. Salamander olfactory
bulb neuronal activity observed by video rate, voltage-sensitive
dye imaging. III. Spatial and temporal properties of responses
evoked by odorant stimulation. J. Neurophysiol.
19. Derby CD and Ache BW. Quality coding of a complex odorant
in an invertebrate. J. Neurophysiol. 1984;51: 906-924.
20. Delaney KR and Hall BJ. An in vitro preparation of frog nose
and brain for the study of odour-evoked oscillatory activity.
J. Neurosci. Methods 1996;68: 193-202.
21. Duchamp-Viret P, Duchamp A and Vigouroux M. Temporal aspects
of information processing in the first two stages of the frog
olfactory system; influence of stimulus intensity. Chem. Senses
1990;15: 349-365.
22. Eckert M and Schmidt U. The influence of permanent odor stimuli
on the postnatal development of neural activity in the olfactory
bulbs of laboratory mice. Dev. Brain Res. 1985;20: 185-190.
23. Evans WJ, Cui L and Starr A. Olfactory event-related potentials
in normal human subjects: effects of age and gender. Electroencephalogr.
Clin. Neurophysiol. 1995;95: 293-301.
24. Freeman WJ.: Mass Action in the Nervous System. New York:
Academic, 1975.
25. Freeman WJ and Skarda CA. Spatial EEG patterns, non-linear
dynamics and perception: the neo-Sherringtonian view. Brain Research
Reviews 1985;10: 147-175.
26. Gelperin A. Nitric oxide mediates network oscillations of
olfactory interneurons in a terrestrial mollusc. Nature 1994;
369: 61-63.
27. Gelperin A, Kleinfeld D, Denk W and Cooke RC. Oscillations
and gaseous oxides in invertebrate olfaction. J. Neurobiol. 1996;
30: 110-122.
28. Gelperin A, Rhines LD, Flores J and Tank DW. Coherent network
oscillations by olfactory interneurons: Modulation by endogenous
amines. J. Neurophysiol. 1993;69: 1930-1939.
29. Gelperin A and Flores J. Vital staining from dye-coated microprobes
identifies new olfactory interneurons for optical and electrical
recording. J. Neurosci. Methods. 1997;72: 97-108.
30. Gelperin A and Tank DW. Odour-modulated collective network
oscillations of olfactory interneurons in a terrestrial mollusc.
Nature Lond. 1990;435: 437-440.
31. Gervais R, Kleinfeld D, Delaney KR and Gelperin A. Central
and reflex neuronal responses elicited by odor in a terrestrial
mollusc. J. Neurophysiol. 1996;76: 1327- 1339.
32. Girardot MN and Derby CD. Neural coding of quality of complex
olfactory stimuli in lobsters. J. Neurophysiol. 1988;60: 303-324.
33. Girardot MN and Derby CD. Independent components of the neural
population response for discrimination of quality and intensity
of chemical stimuli. Brain Behav. Evol. 1990;35: 129-145.
34. Hummel T, Pauli E, Schuler P, Kettermann B, Stefan H and Kobal
G. Chemosensory event-related potentials in patients with temporal
lobe epilepsy. Epilepsia 1995;36: 79-85.
35. Kimura T, Suzuki B, Yamada A, Sekiguchi T and Mizukami A.
Response of oscillatory field potential to some conditioned odors
in slug's brain. Zool. Sci. 1993;9: 1241.
36. Kleinfeld D, Delaney KR, Fee MS, Flores JA, Tank DW and Gelperin
A. Dynamics of propagating waves in the olfactory network of a
terrestrial mollusk: an electrical and optical study. J. Neurophysiol.
1994;72: 1402-1419.
37. Klemm WR, Lutes SD, Hendrix DV and Warrenburg S. Topographical
EEG maps of human responses to odors. Chem. Senses 1992;17: 347-361.
38. Kobal G and Hummel C. Cerebral chemosensory evoked potentials
elicited by chemical stimulation of the human olfactory and respiratory
nasal mucosa. Electroencephalogr. Clin. Neurophysiol. 1988;71:
241-50.
39. Kuettner A, Joerges J and Menzel R. Optical imaging studies
of olfactory coding in the honeybee's antennal lobes. Soc. Neurosci.
Abstr.1995; 21: 135.
40. Laurent G and Davidowitz H. Encoding of olfactory information
with oscillating neural assemblies. Science 1994;265: 1872-1875.
41. Laurent G., Wehr M. and Davidowitz H. Temporal representations
of odors in an olfactory network. J. Neurosci. 1996;16: 3837-3847.
42. Lorig TS, Huffman E, DeMartino A and DeMarco J. The effects
of low concentration odors on EEG activity and behavior. J. Psychol.
1991;5: 69-77.
43. Lorig TS, Turner JM, Matia DC and Warrenburg S. The contingent
negative variation in an odor labeling paradigm. Psychophysiology
1995;32: 393-398.
44. Lorig TS, Matia DC, Peszka J and Bryant DN. The effects of
active and passive stimulation on chemosensory event-related potentials.
Int. J. Psychophysiol. 1996;23: 199-205.
45. MacLeod K and Laurent G. Distinct mechanisms for synchronization
and temporal patterning of odor-encoding neural assemblies. Science.
1996;274: 976-979.
46. Mellon DeF. Characterization of oscillatory interneurons in
the procerebrum of the crayfish. J. exp. Biol. 1992;167: 15-38.
47. Ohloff G. Chemistry of odor stimuli. Experientia 1986; 42:
271.
48. Parnefjord R and Ba-ar E. Delta oscillations as a correlate
to acoustical perception at the auditiry threshhold. Soc. Proc.
Electroenceph. clin. Neurophysiol. 1995;94: 44.
49. Sawada K, Koyama E, Kubota M, Hayashi I, Komaki R, Inui M
and Torii S. Effects of odors on EEG relaxation and alpha power.
Chem. Senses 1992;17: JASTS XXV Abstracts 88.
50. Schuermann M, Ba-ar-Eroglu C, Kolev V and Ba-ar E. A new metric
for analyzing single-trial event-related potentials (ERPs): Application
to human visual P300 delta response. Neuroscience Letters 1995;197:
167-170.
51. Schuett A and Ba-ar E. The effects of acetylcholine, dopamine
and noradrenaline on the visceral ganglion of Helix pomatia -
II. Stimulus-evoked field potentials. Comp. Biochem. Physiol.
1992;102C: 169-176.
52. Schuett A and Ba-ar E. Olfactory field potential oscillations
in the isolated Helix brain: different odors induce different
rhythmicities. Proceedings of the 39th Annual Meeting of the German
Electroencephalography Society 1994;148.
53. Schuett A, Ba-ar E and Bullock TH. The effects of acetylcholine,
dopamine and noradrenaline on the visceral ganglion of Helix pomatia
- I. Ongoing compound field potentials of low frequencies. Comp.
Biochem. Physiol. 1992;102C: 159-168.
54. Schuett A, Bullock TH and Ba-ar E. Dynamics of potentials
from invertebrate brains. In: Ba-ar E. Brain function and oscillations.
Vol. II. Integrative brain function. Neurophysiology and cognitive
processes. Berlin Heidelberg New York: Springer, 1999: 91-108.
55. Schuett A, Bullock TH and Ba-ar E. Odorant-evoked field potentials
of the Helix pedal ganglion are correlated to behavior. G"ttingen
Conference of the German Neuroscience Society, May 1999.
56. Sturbeck K. Vergleichende Analyse evozierter Potentiale von
Invertebraten und Vertebraten. Dissertation, Medical University
Luebeck, 1988.
57. Suzuki N. Behavioral and electrical responses of the land
snail, Ezohelix flexibilis (Fulton), to odours. J. Faculty of
Science Hokkaido Universiy 1967;16: 174-185.
58. Tank DW, Gelperin A and Kleinfeld D. Odors, oscillations,
and waves: Does it all compute? Science 1994;265: 1819-1820.
59. Van Toller S, Behan J, Howells P, Kendal-Reed M and Richardson
A. An analysis of spontaneous human cortical EEG activity to odours.
Chem. Senses 1993;18: 1-16.
60. Witte OW, Speckmann E.-J and Walden J. Acetylcholine responses
of identified neurons in Helix pomatia - II. Pharmacological properties
of acetylcholine responses. Comp. Biochem. Physiol. 1985;80C:
25-35.
61. Youden WJ. Statistical Methods for Chemists. New York: John
Wiley & Sons, Inc., 1964 : 18-20.
62. Zakharov IS, Ierusalimsky VN and Balaban PM. Pedal serotonergic
neurons modulate the synaptic input of withdrawal interneurons
of Helix. Invertebrate Neuroscience 1995;1: 41-52.
63. Zatorre RJ, Jones-Gotman M, Evans AC and Meyer E. Functional
localization and lateralization of human olfactory cortex. Nature
1992;360: 339-340.