Yordanova, J., Kolev, V. (1997). Developmental
changes in the event-related EEG theta response and P300. Electroencephalography
and clinical Neurophysiology, 104: 418-430. Copyright ©
1997 Elsevier Science Ireland Ltd.
Developmental Changes in the Event-Related EEG
Theta Response and P300
Juliana Yordanova* and Vasil
Kolev
Institute of Physiology,
Bulgarian Academy of Sciences, Acad. G. Bonchev str., bl. 23, 1113 Sofia,
Bulgaria
Accepted for publication: 8 May 1997
*Corresponding author:
Tel.: (359) 2-979-37-49
Fax: (359) 2-738-469
email: jyord@iph.bio.bas.bg
Abstract
Event-related potentials (ERPs) from 50 children
(6 to 11 years) and ten adults were elicited by auditory passive, and by
rare target and frequent nontarget stimuli, and analyzed in the time and
frequency domains. The latency of the maximal theta response (or the theta
frequency component of the ERP) was evaluated with respect to age and scalp
topography effects. The major findings were: (1) The latency of the
maximal theta response decreased with increasing age in children, although
for each stimulus type and location adults had shorter latencies than the
children. (2) The developmental time course of latency reduction
depended on the electrode location, with the most prominent reduction occurring
at 8 years at Cz, and no differences between children groups obtained for
the frontal site. (3) Maximal theta response latency was strongly associated
with the latency of the late parietal P400-700 (P3b) component in children.
The results suggest that the developmental latency decrease in P300 processes
originate from a decrease in the preceding theta-related processes and
may reflect a speeding of cognitive stimulus evaluation. © 1997 Elsevier
Science Ireland Ltd.
Keywords: Children; Event-related potentials;
Theta response; P300-wave
1. Introduction
In addition to time domain analysis, frequency domain
analysis can be an informative way for studying event-related electroencephalographic
(EEG) activity. After external stimulation, functionally meaningful oscillatory
EEG responses in different frequency bands (delta, theta, alpha, gamma)
have been recorded from the brain (Basar and Bullock, 1992; Pantev et al.,
1994; Basar et al., 1997). These EEG responses have been proposed to originate
from the event-related reorganization of the ongoing (spontaneous) EEG
as revealed by the frequency stabilization, time- or phase-locking to stimulus,
and amplitude enhancement or damping of the post-stimulus EEG (Davis, 1973;
Sayers et al., 1974; Basar, 1980, 1992; Parvin et al., 1980). Within this
view, event-related oscillatory potentials strongly depend on the spontaneous
EEG activity.
Developmental studies have found that the frequency
content of the spontaneous EEG undergoes significant alterations with increasing
age in children (Petersén and Eeg-Olofsson, 1971; Matouek and Petersén,
1973; Niedermeyer, 1993): The frequencies of the dominant spectral
components increase (Katada et al., 1981), while the absolute and relative
power of the EEG in the slower (delta and theta) frequency bands decrease
with age (Matthis et al., 1980; John et al., 1980; Gasser et al., 1988).
Given these natural changes in spontaneous EEG rhythms from childhood to
adulthood, as well as the likely functional significance of evoked oscillations,
the analysis of event-related frequency responses of the EEG in children
might provide an useful physiological approach to study developmental variations
in the processes of stimulus information processing.
In view of functional significance, the EEG theta
band (4-7 Hz) activity of adults has been consistently correlated with
higher cognitive and associative brain processes like arithmetic operations,
mental rotation, concept learning, etc. (Mizuki et al., 1980, 1983; Lang
et al., 1989; Inouye et al., 1994). Likewise, the stimulus-related EEG
theta response, defined as the 4-7 Hz frequency component of the event-related
brain potentials (ERPs), also has been correlated with cognitive brain
operations: Major results from averaged potentials have suggested
that the phase-locked theta band component of the ERP reflects processes
of focused attention (Demiralp and Basar, 1992; Basar-Eroglu et al., 1992).
Further, the frontal-central event-related theta activity increased with
increase in memory load, but the differences in theta power as a
function of conceptual operations in working memory were substantially
reduced after the averaged ERPs had been subtracted from the single-trial
waveforms (Mecklinger et al., 1992). Hence, the phase-locked theta activity
of ERPs was mainly responsible for the observed memory effects. In another
study, by quantifying both the phase-locked and non-phase-locked theta
activity, an increase in theta response power has been described for stimuli
engaging episodic memory processes (Klimesch et al., 1994, 1996). Taken
together, these findings from adults indicate that stimulus cognitive evaluation
appears primarily associated with enhanced phase-locked theta activity
of the ERP. However, the EEG theta power decreases as children mature and
is relatively small in adults, although the efficiency of cognitive functioning
improves markedly in the course of development (Piaget, 1969; Mussen et
al., 1987). A possible explanation of this fact might be that the functional
significance of EEG theta activity is different in children and adults.
For example, by using relative power spectra of the spontaneous EEG, Gasser
et al. (1988) have demonstrated that theta activity was present in each
age group from 6 to 17 years, but its developmental reduction was accompanied
by a complementary (substituting) increase in fast alpha activity. During
spontaneous EEG recording however, no active processing is required.
In task conditions, where thinking, mental arithmetic, and concentration
of attention were imposed, increased mid-line frontal theta activity, called
FmTheta, was observed in both 7-17-year-old children and adults, with incidence
of occurrence comparable for the groups of children and adults (Yamaguchi,
1981). Hence, it may be assumed that changes in the mode and/or speed of
theta system involvement during stimulus processing as reflected by the
phase-locked EEG theta responses accompany brain development.
The present study was designed to test this hypothesis
by analyzing developmental theta frequency components of ERPs elicited
by auditory stimuli in 6-11-year-old children. Passive and actively processed
task stimuli were used to examine whether developmental effects were restricted
to a specific processing condition. To assess age- and task-related differences
in the magnitude and timing of phase-locked theta activity, the maximal
theta response amplitude and latency in averaged filtered ERPs were evaluated.
Previous reports have demonstrated that prominent theta responses can be
recorded after sensory stimulation in three-year-old children, but the
responses in these children, though large in amplitude, were considerably
delayed relative to those in adults (Kolev et al., 1994a; Basar-Eroglu
et al., 1994). These findings imply that despite the expected developmental
decrease in theta response magnitude, a speeding of theta response latency
might occur as children grow older.
In the time domain, the P300 ERP component has been
correlated with general cognitive functions such as attention and memory
(e.g., Wickens et al., 1984; Donchin and Coles, 1988; Picton, 1992), with
its peak latency proposed to reflect the speed with which attentional resources
are allocated when immediate memory is updated (Polich et al., 1983; Polich,
1986, 1993). The similar sensitivity of P300 and theta response to task
variables has already focused attention (Basar-Eroglu et al., 1992; Klimesch
et al., 1994). Time-frequency ERP analysis has shown that sub-delta, delta,
and theta frequency components may contribute to P300 expression (Duncan-Johnson
and Donchin, 1979; Schürmann et al., 1995; Stampfer and Basar, 1985;
Yordanova and Kolev, 1998). Also, P300 amplitude has been positively correlated
with the power of the spontaneous theta activity (Intriligator and Polich,
1994, 1995), and P300 latency and amplitude have been shown to depend on
the event-related theta responses that precede P300 generation (Yordanova
and Kolev, 1998). Hence, in addition to the direct contribution of theta
power to P300, a functional association may also exist between these ERP
components. In the present study, the relationship between event-related
theta activity and P300 was assessed by using a developmental model. P300
latency has been previously found to be longer in children than in adults
and to decrease significantly from childhood to adulthood (Goodin et al.,
1978; Courchesne, 1983, 1990; Kurtzberg et al., 1984; Mullis et al., 1985;
Ladish and Polich, 1989; Polich et al., 1990), and theta response latency
has manifested a considerable delay in young children compared to adults
(Kolev et al., 1994a; Basar-Eroglu et al., 1994). It is hypothesized that
if the theta response and P300 are associated, the age-dependent variations
in P300 latency should be related with those of theta response latency.
2. Material and methods
2.1. Subjects
A total of 50 healthy children from 6 to 11 years
of age and ten adults from 20 to 30 years of age were assessed. As presented
in Table 1, the ages of children ranged between 72
and 132 months, and were divided into 5 age groups consisting of 10 subjects
(4-6 F) each.
Children were obtained from local schools and adult
subjects were volunteers, primarily students from the Sofia Medical University.
Interviews with teachers and parents of the children revealed no signs
of attentional, behavioural, or learning problems. The children were of
similar socio-economic status (professional - executive) as assessed by
parents' education and occupation, and had normal and above level of intelligence.
Subjects were right-handed, denied any history of neurologic, psychiatric,
or hearing problems, and were paid for their participation in the experiment.
Table 1. Distribution of the subjects studied
according to age.
|
|
Children
|
|
|
|
|
Adults
|
|
|
6-7 years
(n = 10)
|
7-8 years
(n = 10)
|
8-9 years
(n = 10)
|
9-10 years
(n = 10)
|
10-11 years
(n = 10)
|
20-30 years
(n = 10)
|
| Mean age(years) |
6.50
|
7.60
|
8.50
|
9.30
|
10.60
|
24.10
|
|
(months)
|
77.90
|
91.20
|
102.10
|
111.50
|
127.10
|
289.20
|
|
SD (months)
|
4.65
|
3.25
|
4.68
|
3.03
|
4.43
|
44.40
|
2.2. Stimuli and procedure
The subjects were assessed in a dimly lit, electrically
shielded room and were monitored by means of a closed-loop TV and interphone
system. Children were provided sufficient time before the recording sessions
to become acquainted with the environment.
The auditory stimuli were generated by an IBM PC,
filtered, amplified, and reproduced by a loudspeaker in a free-sound field.
All stimuli were presented at 60 dB SPL, with a duration of 50 ms (r/f
10 ms). The stimuli were delivered with random inter-stimulus intervals
(3.5 - 6.5 s) in two different task situations: (1) Tone bursts of
800 Hz frequency (N=50) were presented in a passive listening condition,
with subjects instructed to relax silently keeping their eyes closed. Before
the recording session, they were told that the stimuli would be delivered
for testing the technical equipment and would be of no relevance for them.
(2) Auditory target and nontarget stimuli were presented in an oddball
task. During the oddball condition, 100 high and low tones (1200 Hz and
800 Hz respectively) were delivered randomly, with p=0.75 for the high
tones, and p=0.25 for the low tones. Subjects were required to keep their
eyes closed and press a button with their dominant hand as quickly and
accurately as possible in response to the low tones.
2.3. Data collection and processing
2.3.1. Electrodes
The EEG data were recorded with Ag-AgCl disc electrodes
placed on mid-line frontal, central, and parietal sites (Fz, Cz, and Pz),
with linked mastoids as the reference. The ground electrode was positioned
on the forehead. The electrooculogram (EOG) was recorded bipolarly with
electrodes placed below and at the outer canthus of the left eye. Electrode
impedance during the experiments did not exceed 10 kOhms.
2.3.2. EEG recording, ADC, and data storage
EEG was amplified with cut-off frequencies of 0.5
and 70 Hz by means of a Nihon Kohden Electroencephalograph (model EEG-4314F).
Stop-band filtering (band limits 48-52 Hz) was used for eliminating line
frequency interference. The amplified EEG signals were digitized with a
sampling frequency of 250 Hz (12 bit ADC) and stored for further processing,
with an epoch length of 1024 ms pre- and 1024 ms post-stimulus.
2.3.3. Artifact rejection
The stored raw single sweeps were inspected visually
off-line to eliminate EEG segments contaminated with blink, muscular, or
any other type of artifact activity, with any EEG or EOG trial exceeding
±90 µV for children and ±45 µV for adults excluded
from further analysis. Thus, the number of artifact-free sweeps analyzed
for each subject in each condition was between 40 and 50 for the passive
ERPs, between 55 and 70 for the nontarget ERPs, and about 20-23 for the
target ERPs.
2.4. Data Analysis
2.4.1. Pre-stimulus EEG theta activity
To demonstrate the presence of a developmental decrease
in the ongoing theta activity non-related to stimulus processing, the pre-stimulus
theta activity was analyzed for the sample under study. By using the Fast
Fourier Transform (FFT), power spectral density functions were calculated
for each artefact-free pre-stimulus epoch (-1000, 0 ms) of the passive
condition, and then averaged. For statistical evaluation, the mean absolute
band power (X) in the range of 4-7 Hz was log-transformed according to
the formula Y = log10(X) to normalize the power distributions
(Gasser et al., 1982; Gasser et al., 1988).
2.4.2. Event-related theta activity
ERPs were analyzed in the time and frequency domain.
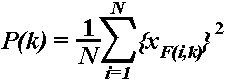
Typical results obtained at different stages of data analysis are illustrated
in Fig. 1. Averaging was performed to obtain and assess
the time domain P300 ERP component and the theta response was analyzed
by applying the following methods:
To verify the presence of event-related theta responses,
(1) power changes in the global (phase-locked and non-phase-locked) activity
were assessed by calculation of stimulus-triggered instantaneous theta
power (Pfurtscheller et al., 1988; Kalcher and Pfurtscheller, 1995), and
(2) amplitude-frequency characteristics (AFCs) of averaged ERPs were computed
(e.g., Basar, 1980; Schürmann and Basar, 1994). For evaluation of
phase-locked theta responses, ERPs were digitally filtered in the
theta range. A short description of the analysis procedures is given below.
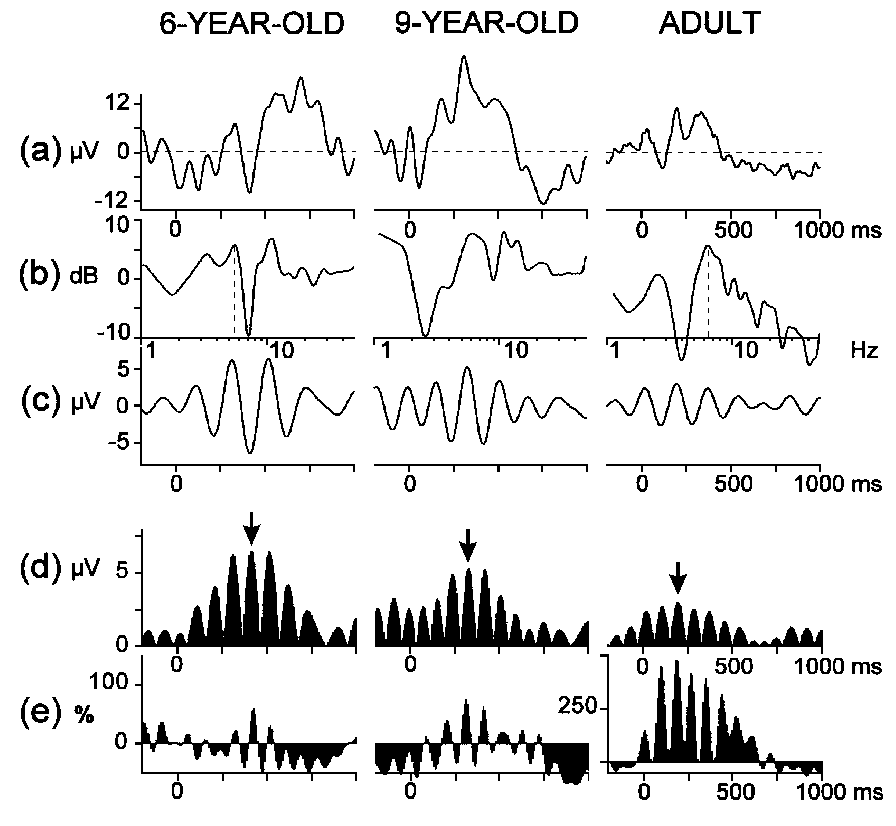
2.4.2.1. Stimulus-related changes in EEG theta power.
The instantaneous power in the 4-7 Hz frequency range was calculated
according to the formula:
 ,
,
where P(k) = averaged power estimation of bandpass filtered
data (averaged over all single sweeps), xF(i,k)
= k-th sample of the i-th sweep of the bandpass filtered
data, and N = number of the single sweeps (Kalcher and Pfurtscheller,
1995). In this way, single sweeps of each subject, stimulus type, and electrode
location were bandpass filtered in the theta range (4-7 Hz) (see Section
2.4.2.3.), the samples were squared and then averaged over trials. Event-related
synchronization (ERS) was quantified as the percentage change of the averaged
theta power P(k) at each sampling point relative to the average
theta power R in a reference interval chosen from the pre-stimulus
epoch (-900, -400 ms):
ERS(k) = {[P(k) - R]/R}X100%.
Typical results from children and an adult are illustrated in Fig.
1e.
|
Fig. 1. Event-related potentials from target tones at Pz in three representative
subjects from different age groups: (a) averaged ERPs, (b) amplitude-frequency
characteristics, (c) digitally bandpass (4-7 Hz) filtered ERPs, (d) rectified
wave forms from (c), (e) event-related synchronization calculated from
the instantaneous theta power. Arrows indicate the identified maximal theta
response. Along the x-axes: (a), (c), (d), (e) time (stimulus on-set
is at 0 ms), (b) log10(frequency). Along the y-axes: (a),
(c), (d) amplitude, (b) 20log10AFC,
(e) relative theta power increase/decrease against reference power
in the -900, -400 ms epoch. |
2.4.2.2. Amplitude frequency-characteristics. The
AFC describes the brain system's transfer properties, e.g., excitability
and susceptibility, by revealing resonant as well as salient frequencies
(Basar, 1980; Röschke et al., 1995). It therefore does not simply
represent the spectral power density characterizing the transient signal
in the frequency domain but the predicted behaviour of the system if sinusoidally
modulated input signals of defined frequencies were applied as stimulation.
As reflecting the amplification in a given frequency channel, the AFC is
expressed in relative units (dB). Hence, the presence of a peak in the
AFC reflects the resonant frequencies interpreted as the most preferred
oscillations of the system in response to stimulus. To obtain AFCs, the
averaged ERPs (Fig. 1a) were transformed to the frequency
domain by means of one sided Fourier Transform of the following form (Solodovnikov,
1960; Basar, 1980):
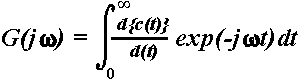 ,
,
where  =
complex representation of the Fourier transformed time series (ERP) known
as frequency characteristics of the system, c(t)
= transient step response of the system (in this case, the ERP),
=
complex representation of the Fourier transformed time series (ERP) known
as frequency characteristics of the system, c(t)
= transient step response of the system (in this case, the ERP),  is the angular frequency, f = frequency
of the input signal, j =
is the angular frequency, f = frequency
of the input signal, j =  ,
the imaginary unit. From the complex function
,
the imaginary unit. From the complex function  ,
where RE and IM
represent the real and imaginary part of the function, respectively, the
AFC can be calculated as a function of f:
,
where RE and IM
represent the real and imaginary part of the function, respectively, the
AFC can be calculated as a function of f:
 ,
,
or in a digital form:
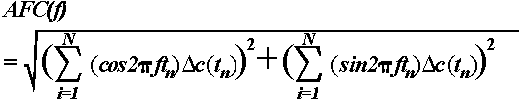 .
.
Here,  c(tn)
represents the first derivative of the transient step response of the system
(in this case, the ERP) at different sampling points tn,
ranging from 1 to N. Although the one sided
Fourier Transform is valid only for linear systems, it can be applied to
nonlinear systems as a first approximation since errors due to system nonlinearities
are smaller than errors resulting from the length of measurements and rapid
transitions in brain activity.
c(tn)
represents the first derivative of the transient step response of the system
(in this case, the ERP) at different sampling points tn,
ranging from 1 to N. Although the one sided
Fourier Transform is valid only for linear systems, it can be applied to
nonlinear systems as a first approximation since errors due to system nonlinearities
are smaller than errors resulting from the length of measurements and rapid
transitions in brain activity.
The AFCs of the averaged ERPs were calculated for
the 0-1000 ms epoch after stimulus and then normalized such that the amplitude
at 1 Hz was equal to 1 (or 20log101 = 0) to enable demonstration
of peaks in different frequency ranges including theta (Fig.
1b).
2.4.2.3. Digital filtering. Single sweeps in each
series were digitally bandpass filtered in the theta frequency range (4-7
Hz) and then averaged to reduce the non-phase locked components (Kalcher
and Pfurtscheller, 1995), as illustrated in Fig. 1c.
To provide a zero phase shift, a modified linear bandpass filter was used,
whose weights were based on binomial coefficients (Wastell, 1979). The
filter band width was chosen to be 6.5% from the total analyzed frequency
band, which was experimentally tested to minimize filtering artifacts.
To achieve this ratio, the original signals were re-sampled with a sampling
frequency of 125 Hz, which is within the Nyquist theorem limits for
the frequencies of interest. The exact half-power frequencies of the digital
filter were 3.91 and 7.32 Hz, referred to as 4 and 7 Hz in the text. The
length of the filtered single sweep epochs was 2048 ms (-1024, +1024 ms)
so that possible edge effects did not alter the analysis epoch.
2.4.2.4. Amplitude and latency of the maximal theta response.
To evaluate the phase-locked event-related theta activity, the maximal
peak-to-peak amplitude was measured in the averaged filtered ERPs of each
subject for each stimulus type and electrode. As shown in Fig.
1d, the averaged ERPs were rectified after filtering and the latency
of the maximal theta response was measured. Maximal theta response was
identified as the wavelet with the highest amplitude in the rectified curve,
and the peak amplitude value was used to measure its latency. In fact,
such an identification corresponds to the maximum of the envelope of the
oscillation.
2.4.3. Statistical analysis
Individual amplitude and latency values were subjected
to a repeated measure analysis of variance with one between-subject variable:
age (6 age groups) and two within-subjects variables: stimulus type
(passive, target, and nontarget) and lead (Fz, Cz, and Pz). Behavioural
data were also tested for the effect of age. Greenhouse-Geisser correction
procedure was applied to the analyses with repeated measures factors. The
original df and the probability values from the reduced df are reported
here. Bonferroni correction to the probability values was employed for
the post-hoc contrasts performed. Maximal theta response latency, P300
latency, and RT were subjected to correlation and multiple regression analyses.
3. Results
3.1. Behavioural data
As indicated by the significance of the overall
age factor (F(5/54) = 14.5, P < 0.001), reaction times (RTs)
to targets decreased with increasing age in children (group means of 6-7-,
7-8-, 8-9-, 9-10-, and 10-11 year old children: 716, 702, 675, 602,
472 ms), but were significantly slower than those of adults (mean 390 ms).
RTs did not differ between the groups of 6-9 year olds, who also manifested
significantly slower responses than 9-10 and 10-11 year old children. The
error rate was higher in children relative to adults, but this difference
was not significant (misses, F(5/54) = 1.23, P > 0.1; false alarms,
F(5/54) = 2.04, P > 0.1).
3.2. P300 of time domain ERPs
Figure 2 presents the grand
average auditory passive, target, and nontarget ERPs in the five children
and single adult groups. In the passive condition, a positive wave in the
P300 latency range was elicited in both children and adults, possibly due
to the long and varying inter-stimulus intervals (e.g., Polich 1990;
Picton 1992). In the oddball condition, the target and nontarget ERPs of
children were characterized by a late positive complex comprising an early
wave at the frontal, central and parietal midline locations with a mean
latency of 330 ms - P330, and a late positive slow wave at the parietal
site - P400-700. In contrast, a single P300 wave with a mean latency of
340 ms was recorded in adults at the three electrodes for the targets and
nontargets. Therefore, P330 measures were subjected to a three-way ANOVA
age (6 age groups) x stimulus (target vs. nontarget) x lead (Fz, Cz, Pz),
and the P400-700 measures at Pz were subjected to a two-way ANOVA
age (5 children groups) x stimulus (target vs. nontarget). P330 amplitude
and latency did not depend on the age factor. P330 amplitude was higher
for targets than for nontargets (stimulus, F(1/54) = 17.63, P <
0.001; 8.5 vs. 5.9 µV), and was maximal at Pz (lead, F(2/108) = 27.2,
P < 0.001). The latency of P400-700 decreased significantly with
advancing age in children (age, F(4/45) = 9.31, P < 0.001), a
result observed clearly in Fig. 2. As also illustrated
in the figure, the oddball targets produced significantly larger P400-700
amplitudes in comparison with the frequent nontargets (stimulus, F(1/45)
= 49.6, P < 0.001; 13.0 vs. 8.9 µV). It is important to
note that, as seen in Fig. 2, the latencies of the
time domain components preceding P330 (N1, P2, and N2) did not depend on
the age factor (age, F(4/45) < 2.1, P > 0.1).
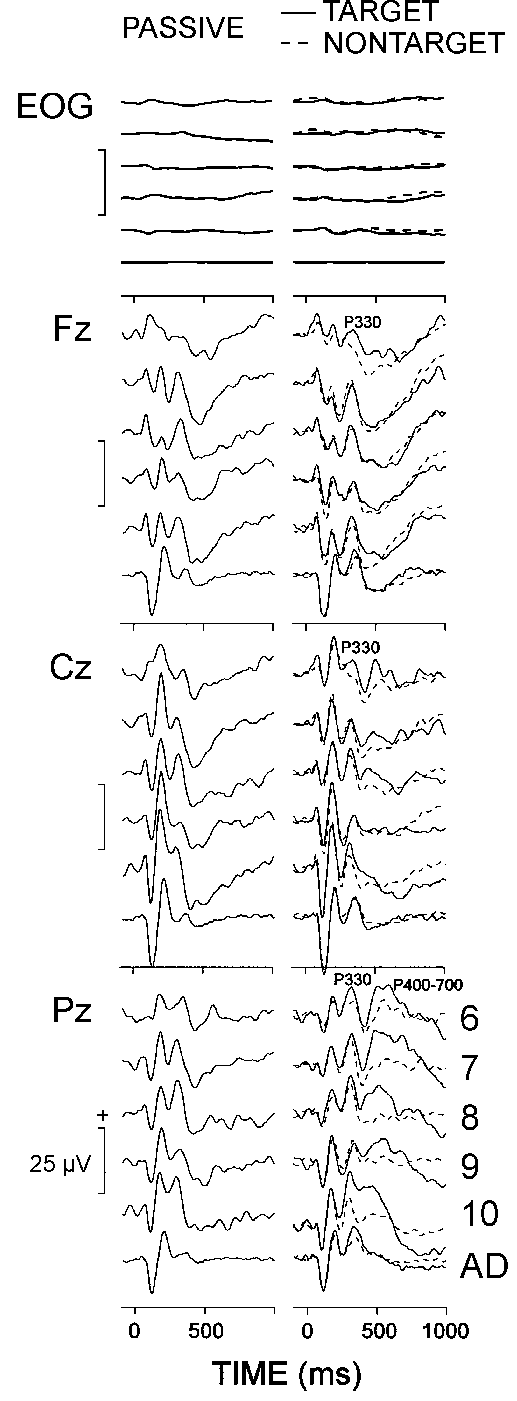
|
| Fig. 2. Grand average passive, target, and nontarget ERPs at three
electrode locations of six age groups (6: 6-7 year olds, 7:
7-8 year olds, 8: 8-9 year olds, 9: 9-10 year olds, 10:
10-11 year olds, AD: adults). Each age group consists of 10 subjects.
Stimulus is presented at 0 ms. |
3.3. Pre-stimulus theta power
The log-transformed values of the absolute theta
power of the EEG preceding the passive ERPs were subjected to age x lead
analysis of variance. As illustrated in Fig. 3, the
significant age effect (F(5/54) = 52.8, P < 0.001) resulted from
the gradual decrease in theta power between 6 and 11 years, with the lowest
values manifested by adults. The pre-stimulus theta power was highest at
Cz in 7-11 year olds (lead, F(2/108) = 10.53, P < 0.001), at
Pz and Cz in 6-7 year olds, and at Fz and Cz in adults (age x lead, F(10/108)
= 2.7, P = 0.055).
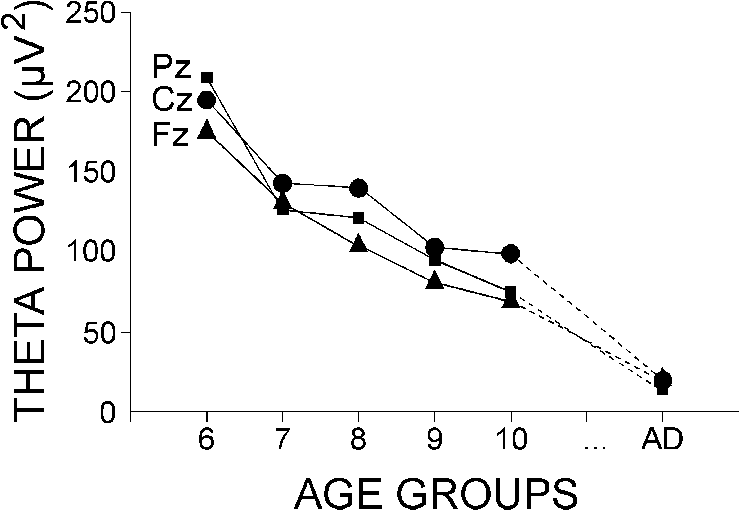
|
| Fig. 3. Group mean theta band power (4-7 Hz) of the pre-stimulus EEG
activity in passive condition at Fz, Cz, and Pz. The age groups are designated
as in Fig. 2. |
3.4. Event-related theta activity
Although only the phase-locked theta responses in
the averaged filtered ERPs were quantitatively analyzed, the presence of
event-related theta activity was verified by the changes in the power of
the total (phase-locked and non-phase-locked) theta EEG activity
and by the peaks from the theta (4-7 Hz) range in the AFCs.
3.4.1. Event-related changes in theta response power
Figure 4 illustrates that both
children and adults manifested a prominent increase in the EEG theta power
in the first 500-600 ms after auditory stimulus presentation. In addition,
the figure shows that: (1) The power increase in adults (mean 550%)
was substantially larger than that in children (mean 125%), with no reliable
differences observed among children groups. (2) For each stimulus type
the adults manifested a pronounced power increase (synchronization) in
the first 500-600 ms after stimulation. In children, a subsequent decrease
(desynchronization) was found for the target ERPs, which was expressed
primarily at Cz and Pz. (3) The target ERPs of 6-7-year-old children differed
from both the passive and nontarget ERPs, as well as from the rest of groups
under study, because no synchronization within the 500 ms period was evident
at central and parietal locations.
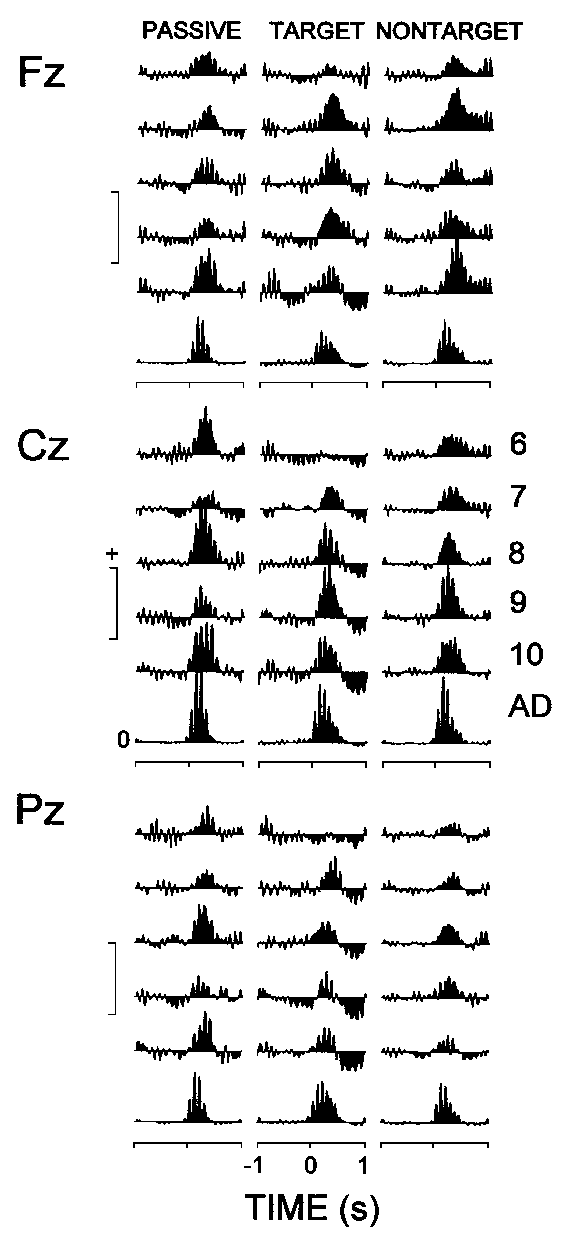
|
| Fig. 4. Group means of the event-related synchronization (positive
values) and desynchronization (negative values) calculated from the instantaneous
theta power against the reference epoch -900, -400 ms. The different age
groups are designated as in Fig. 2. Along the y-axes:
calibration mark is 160% for children, and 600% for adults. |
3.4.2. Amplitude-frequency characteristics
Mean group AFCs obtained by averaging individual
AFCs in the frequency domain are illustrated in Fig. 5.
As seen in the figure (shaded area), AFCs of children contained one
or more separate peaks in the theta range. Individual AFCs of adults were
characterized by a wide-band component covering theta and alpha ranges
(4-13 Hz), or by a single peak in the theta range.
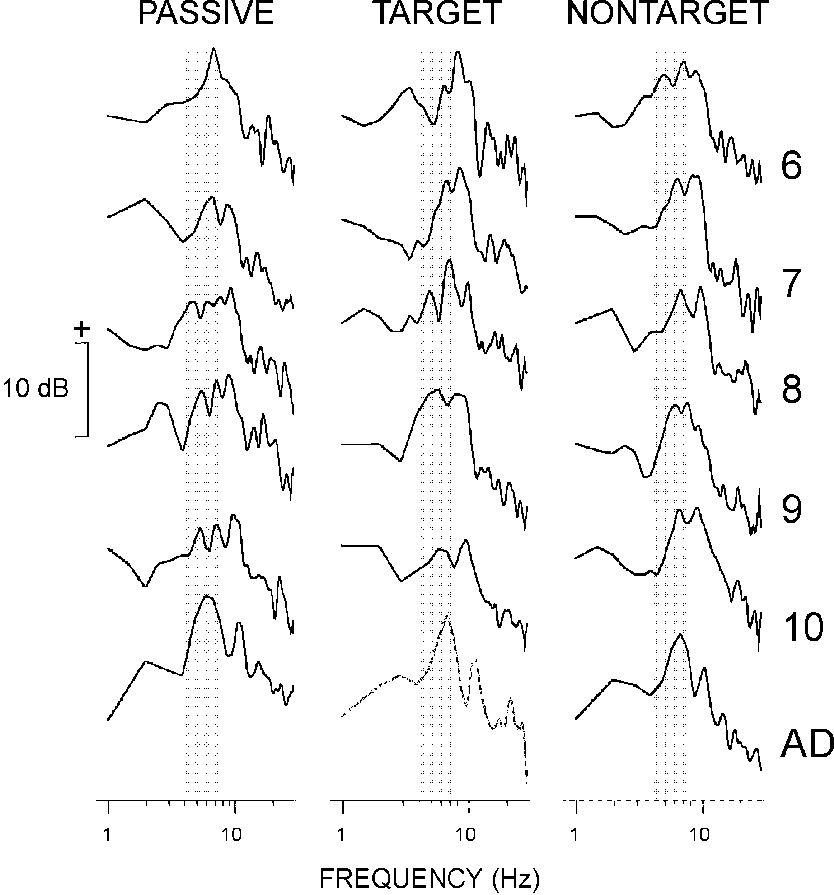
|
| Fig. 5. Mean group amplitude frequency characteristics. Along the y-axis
20log10AFC. The AFCs are normalized such that the amplitude
at 1 Hz is equal to 0 (or 20log101 = 0). The age groups are
designated as in Fig. 2. Shaded areas show the theta
frequency band (4-7 Hz). |
3.4.3. Filtered (4-7 Hz) ERPs
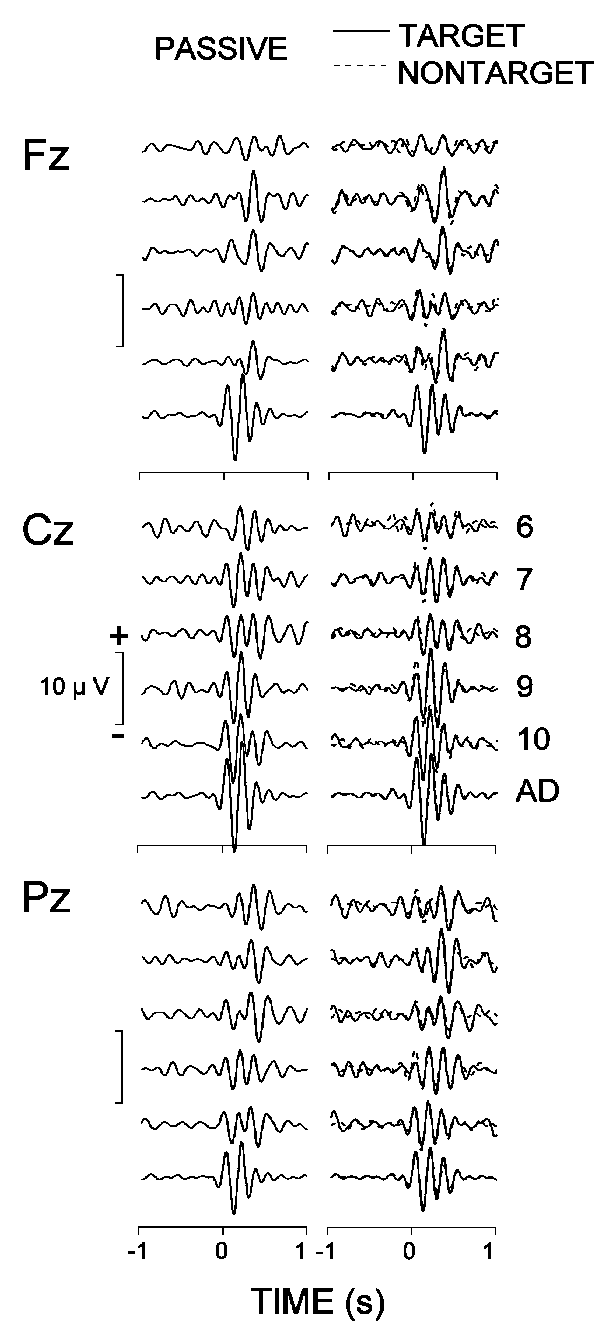
Figure 6 presents the filtered
(4-7 Hz) grand average auditory passive, target, and nontarget ERPs at
Fz, Cz, and Pz, and demonstrates that the evoked theta patterns vary across
subject age and electrode location. At Pz, the maximal theta responses
in 6-9-year-old children were delayed considerably for all stimuli relative
to those in adults and 9-11-year-old children. The older children (9-11
years) also manifested a prominent increase in amplitude and decrease in
latency of the maximal theta response at the central site. Further, the
frontal theta patterns of adults differed from those of children, since
all children groups produced delayed frontal theta responses. Also, the
differences between groups of children at Fz did not resemble those at
Cz and Pz.
|
| Fig. 6. Grand average passive, target, and nontarget ERPs at three
electrode locations bandpass filtered in the theta (4-7 Hz) range. The
different age groups are designated as in Fig. 2. |
3.5. Statistical analysis
Results from the repeated measure analysis of variance
age x stimulus x lead of maximal theta response amplitude and latency are
summarized in Table 2, with the major significant
effects illustrated in Fig. 7.
3.5.1. Maximal theta response amplitude
Table 2 shows that no significant
age effect was obtained. The theta response was largest for the targets
and lowest for the nontargets (stimulus, P < 0.01), although
this difference was not significant for the groups of 6-7 and 10-11 year
old children (stimulus x age, P < 0.01). As seen in Fig.
6, theta response amplitude was maximal at the vertex site (lead, P
< 0.001), with no significant interactions obtained for the lead with
age or stimulus type factors.
Table 2. Results from repeated measures
analyses of variance on the maximal theta response.
|
Latency
|
|
Amplitude
|
|
| Source (df) |
F
|
P
|
F
|
P
|
| Age (5,54) |
47.30
|
0.001
|
0.48
|
n.s.
|
| Stimulus (2,108) |
2.03
|
n.s.
|
5.73
|
0.01
|
| S x A (10,108) |
0.75
|
n.s.
|
2.90
|
0.01
|
| Lead (2,108) |
9.26
|
0.001
|
25.08
|
0.001
|
| L x A (10,108) |
4.18
|
0.001
|
1.80
|
n.s.
|
| S x L (4,216) |
3.90
|
0.01
|
0.63
|
n.s.
|
| S x L x A (20,216) |
2.30
|
0.001
|
0.89
|
n.s.
|
3.5.2. Maximal theta response latency
A significant main effect of the age factor was
found (P < 0.001), which occurred primarily from the marked latency
shortening with increasing age, as illustrated in Fig.
6 and Fig. 7. The longest latencies were found
for 6-7 year old children (mean 404 ms) and the shortest latencies were
found for adults (mean 204 ms). Post-hoc univariate F-contrasts revealed
significant differences between each successive pair of age groups, except
for 6-7 vs. 7-8, and 9-10 vs. 10-11 year old children (for each contrast,
F(1/54) > 23.6, P < 0.01). The age-related latency reduction
depended strongly on the recording site, as revealed by the significant
age x lead interaction (P < 0.001). Figure 7
illustrates that the latency decrease began as early as 8 years and was
most prominent at Cz; it was slower at Pz and no significant differences
between groups of children were obtained for the frontal theta responses.
The latency reduction with age depended on the stimulus type only at the
Cz electrode, because the latency for targets was longer than for passive
and nontarget stimuli in the groups of oldest (8-11 year old) children
and adults (age x stimulus x lead, P < 0.001).
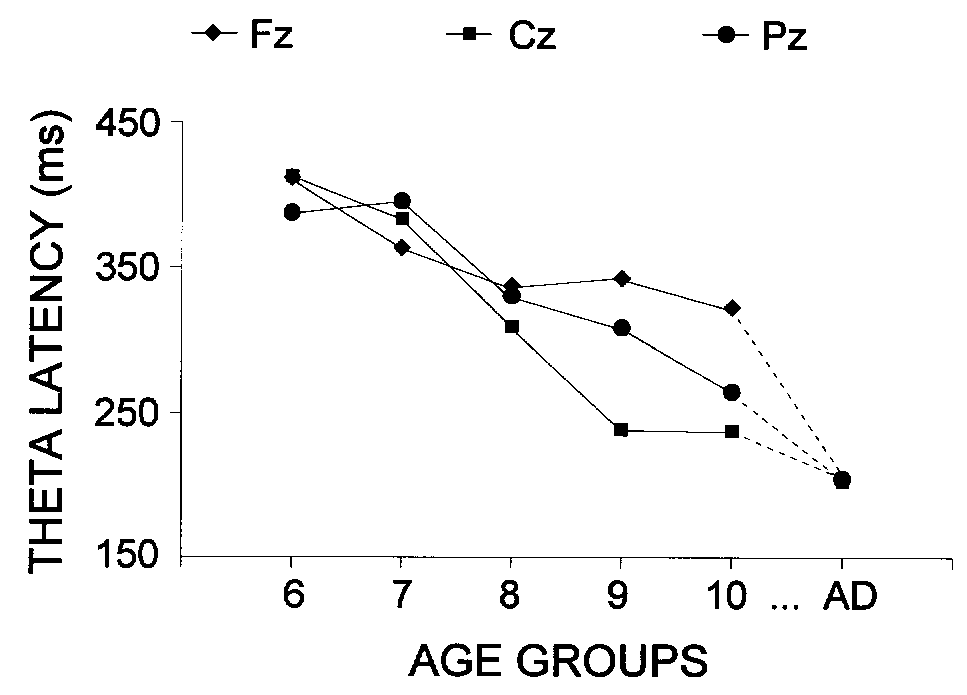
|
| Fig. 7. Lead x age effect on the latency of the maximal theta response.
The age groups are designated as in Fig. 2. |
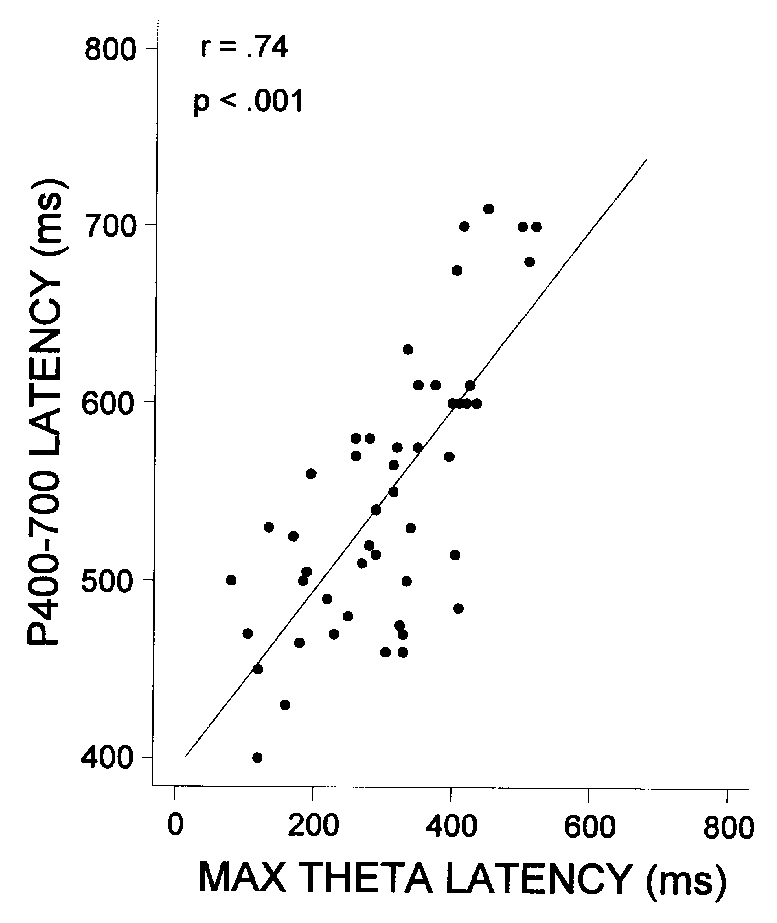
The correlations of the latency of P400-700 with
latency of the maximal theta response at Pz and age are presented in Table
3 and illustrated in Fig. 8. Both the latency of
the maximal theta response and the latency of P400-700 decreased significantly
with age in children, and the correlations among the three variables (age,
P400-700 latency, and maximal theta response latency) were high and significant.
To determine to what extent age influenced P400-700
latency due to the latency reduction of the earlier maximal theta response,
multiple regression analysis was performed for the target ERPs at Pz where
P400-700 occurred. The dependent variable was P400-700 latency, and predictor
variables were theta response latency and subject age in months. Theta
response latency was entered in the first step, and age was entered in
the second step. If age does not predict significant variance of P400-700
latency, then theta response latency can be entirely accounted for the
age-related decrease in P400-700 latency. As summarized in Table
4, the latency of the maximal theta response had a highly significant
predictive value for P400-700 latency, but age did not predict significant
variance in P400-700 latency. The correlations between P400-700 latency
and the latencies of N1, P2, N2, and P330 were low and non-significant.
As reported in Section 3.1., reaction times also
decreased with age (r = -0.57, P < 0.001). However, the
correlations of RT with theta response latency and P400-700 latency were
low and above the level of significance (r < 0.25, P =
0.08), and subject age was the only predictor of the developmental RT decrease
when age, theta response latency, and P400-700 latency were entered as
predictor variables in a multiple regression analysis (R2total
= 0.33; F(3/46) = 7.27, P < 0.001).
Table 3. Pearson r correlations
for P400-700 latency, latency of the maximal theta response at Pz, and
age (n = 50).
|
P400-700 latency
|
Theta response latency
|
Age
|
| P400-700 latency |
-
|
0.74 ***
|
-0.60 ***
|
| Theta response latency |
|
-
|
-0.65 ***
|
| Age |
|
|
-
|
*** P < 0.001.
Table 4. Regression using the latency of
the maximal theta response as a predictor of the P400-700 latency at Pz
in children.
| Dependent variable |
Enter |
Beta |
R2 |
P |
| P400-700 latency |
1. Theta response latency |
0.60 |
0.53 |
<0.001 |
|
2. Age |
-0.21 |
0.34 |
0.12 |
| R2Total = 0.546, F(2/47) = 29.30, P < 0.001 |
| Est(P400-700 latency) = 511 + 0.42(Theta response latency) - 0.88(Age) |
|
| Fig. 8. Scatter plot of P400-700 latency vs. latency of the maximal
theta response for the Pz lead. |
4. Discussion
The present study was designed to evaluate the developmental
changes in the phase-locked theta activity elicited by passive and actively
processed task stimuli. As observed previously, theta responses were recorded
after auditory stimulation in adults (Stampfer and Basar, 1985; Demiralp
and Basar, 1992; Basar-Eroglu et al., 1992; Kolev and Schürmann, 1992;
Yordanova and Kolev, 1998) and children (Basar-Eroglu et al., 1994; Kolev
et al., 1994b; Yordanova et al., 1994; Yordanova and Kolev, 1996, in press).
In addition, new findings on theta response development were obtained.
Whereas the power of the ongoing theta activity decreased with development,
the amplitude of the maximal theta response of averaged ERPs was not affected
by the age factor. However, the time-structure of the event-related theta
activity depended on the age: (1) Latency of the maximal theta response
significantly decreased with increasing age in children from 6 to 11 years,
although for each stimulus type and location adults had shorter latencies
than children from each group. (2) The developmental time course of latency
decrease depended on the recording site, with the most prominent
reduction found at the central electrode location, and no differences between
groups of children obtained at the frontal site. (3) The latency of the
maximal theta response was strongly associated with the latency of the
late parietal wave P400-700 in children, such that the age-related reduction
of P400-700 latency was predicted by the latency of the maximal theta response.
In children as in adults, theta response amplitude was larger for oddball
target than for nontarget and passive stimuli.
4.1. Developmental theta response of ERPs
The existence of event-related EEG theta response
was verified in several ways: (1) Amplitude change (enhancement or
damping) of the post-stimulus EEG relative to the pre-stimulus EEG is a
reliable indicator for the presence of event-related response in a given
frequency range (Basar, 1980; Klimesch et al., 1994; Kalcher and Pfurtscheller,
1995). In the present study, stimulus-induced changes in the theta frequency
channel were demonstrated by the substantial power increase within the
first 600 ms after auditory stimulation in both children and adults (Fig.
4). (2) The amplitude-frequency characteristics of both children
and adults manifested peaks in the theta (4-7 Hz) range (Fig.
5), which also indicates that oscillatory EEG activity in the theta
frequency band was generated in the post-stimulus epochs (Basar, 1980;
Röschke et al., 1995). (3) Prominent oscillatory theta
responses were obtained from the digitally filtered (4-7 Hz) averaged ERPs
of both children and adults (Fig. 6), which shows that
the event-related theta activity was also time- or phase-locked to stimulus
because the non-phase-locked responses were attenuated by the averaging.
4.1.1. Age effect on theta response latency
In the average potential, amplitude values of the
ERP components depend on both the magnitudes and latency jitter or phase-locking
of waves in the single sweeps included in the ensemble for averaging (Woody,
1967; McGillem and Aunon, 1987; Ruchkin, 1988). Hence, the maximal theta
response latency in the averaged ERP reflects the time in the post-stimulus
period in which the most enhanced and synchronized theta responses appear.
The age-related latency reduction may therefore indicate a developmental
speeding in occurrence of enhanced and synchronized theta oscillations.
Indeed, single sweep analysis of data from the same groups of children
has demonstrated that a significant increase in the between-sweep synchronization
or phase-locking of early theta responses (0-300 ms) takes place as children
grow up (Yordanova and Kolev, in press), which shows that the stimulus-related
time-locking in the theta range occurs earlier with increasing age. Recent
data of adults have indicated that event-related theta synchronization
within 370 ms after stimulus correlates with episodic memory processes
(Klimesch et al., 1994, 1996). Also, theta responses of averaged ERPs have
been shown to be enhanced in the early (0-250 ms) post-stimulus epoch if
the task stimuli are attended and highly predictable (Demiralp and Basar,
1992), but somewhat later if the relevant stimuli are unexpected (Basar-Eroglu
et al., 1992). In the context of the parallel systems for sensory-cognitive
processing (Goldman-Rakic, 1988), the theta response has been proposed
to relate specifically to processes of stimulus cognitive evaluation that
occur in parallel with the sensory processes (Demiralp and Basar, 1992).
Thus, speeding of theta response with development may reflect a faster
and earlier initiation of stimulus cognitive evaluation or context integration
(Miller, 1991). Within this framework, the finding that adults had shorter
latency than all of the children groups suggests that even eleven-year-old
children are not able to engage parallel cognitive integration as quickly
as adults.
The developmental reduction in theta response latency
depended on the electrode position: Theta latency was delayed at
the parietal relative to the central location and reduction was virtually
absent at the frontal site. The same pattern of results was observed for
both passive and actively processed stimuli. Although the origin of the
scalp recorded theta activity is not definitely known, it may be assumed
that the maximal theta response at each electrode site reflects the functioning
of the underlying cortical areas (Miller, 1991; Inouye et al., 1994). It
has been shown that frontal lobes achieve functional maturation much later
than each of the other cortical (parietal and central) and deeper brain
structures, perhaps as late as 12 years of age (Luria, 1973; Fuster, 1991;
Rothenberger, 1990). Hence, the incomplete functional maturation of frontal
lobes or fronto-hippocampal connections may be accompanied by delayed frontal
theta responses as found in the present study, and the age-related latency
reduction of the maximal theta response at posterior sites may reflect
a more rapid functional development of centro-parietal brain areas. However,
the latency reduction at the central location was affected also by stimulus
type, which implies that the theta response latency might better be described
in terms of processing capacity resulting from the interaction between
functional development and processing demands.
4.1.2. Age effect on theta response amplitude
The lack of age effect on the maximal theta response
amplitude can be explained with the differential developmental time-course
of single theta response amplitude and between-sweep synchronization (Yordanova
and Kolev, in press). It has been observed that whereas single sweep amplitudes
decreased, the phase-locking increased with age. Hence, the averaged filtered
ERPs did not manifest large differences between children and adults, because
the smaller single-sweep amplitudes of adults are strongly phase-locked,
with the opposite effects found for children. The finding that theta response
amplitude in both children and adults was larger for oddball target than
for passive and nontarget stimuli indicates that the functional engagement
of the theta system is similar for children and adults and accompanies
oddball task processing.
4.2. Theta response and P300
Two pronounced components in the P300 latency range
characterized the task-related ERP morphology in children: an early P330
and a late parietal P400-700 (Courchesne, 1983). In the children groups,
P400-700 manifested significantly larger amplitudes for oddball targets
than for nontargets, a result typically described for the P3b component
(Pritchard, 1981; Picton, 1992; Polich, 1993). P400-700 also decreased
in latency with age as has been reported for P3b in children (Courchesne,
1983; Kurtzberg et al., 1984; Mullis et al., 1985; Polich et al., 1990;
etc.). The early P330, though larger for targets and at Pz, did not demonstrate
any changes in latency as age increased. Hence, according to criteria of
topography, task sensitivity, and changes with development, P400-700 in
children can be identified as the P3b.
In this study, the relationship between the time
domain P400-700 and the maximal theta frequency response was analyzed.
However, the question of whether P400-700 and maximal theta response are
distinct phenomena may be raised. In the framework of signal analysis theory,
ERPs can be analyzed in the time and/or in the frequency domain. The successive
peaks of the transient response in the time domain may present with a single
maximum (peak) in the AFC, which means that multiple waves in the time
domain may be a manifestation of a single oscillation with a defined frequency.
The opposite is also true - several peaks in the frequency domain may present
with only one extremum in the time domain potential. If several frequency
maxima occur in the AFC and they are enough distant, then they may produce
distinct activities (components) in the time domain. It has been further
proposed that the time-domain ERP components originate from the superposition
of oscillatory EEG responses with frequencies that are functionally involved
(responsive) in a given condition (Basar, 1980, 1992). These theoretical
considerations mean that a close relationship exists between time and frequency
domain components of the ERP, but nonetheless they are not identical as
being derived by different methods, and reflect specific aspects of the
transient signal (i.e., the ERP).
Several additional arguments can be outlined to
support the fact that P400-700 and theta response analyzed in the present
study are distinct phenomena: (1) Figure 2 clearly
shows that the parietal P400-700 wave of the unfiltered ERPs of children
is a slow wave from the delta (0.5-4 Hz) range. Furthermore, a number of
earlier and most recent reports have shown that the major power of the
P300 ERP component is in the delta range (Duncan-Johnson and Donchin, 1979;
Stampfer and Basar, 1985; Verleger 1995; Schürmann et al., 1995).
(2) As shown in the results, the theta response was elicited in each of
the three stimulus conditions (Fig. 6), whereas at
low cut-off frequency of 0.5 Hz prominent P400-700 of children was elicited
only in the oddball target condition (Fig. 2). (3)
The theta response was evident at each electrode location and was maximal
at the vertex site (Fig. 6), whereas P400-700 was expressed only at the
parietal site (Fig. 2). (4) The latency of the maximal
theta response was about 200 ms shorter than P400-700 latency, which means
that the two events are separated along the time axis and are not overlapping.
Hence, the maximal theta response in children contributes to the expression
of time domain components earlier than P400-700. In support to this statement,
it is seen in Figs. 2 and 4 that
in children theta power increase precedes P400-700 and rather a theta power
suppression (desynchronization) accompanies P400-700 peaking. The separability
of the theta response and P400-700 shows that the relationship between
these two ERP components in children is functional rather than resulting
from a direct contribution of theta power to P400-700 expression. In adults,
however, the latency of the maximal theta response similarly preceded P300
latency, but pronounced theta activity was also observed to coincide with
P300 appearance (Figs. 4 and 6).
The present results confirm the observations of
a decrease in P3b (P400-700) latency with age in children, which may reflect
a developmental speeding in the processes of stimulus evaluation (Kutas
et al., 1977) or timing of attentional processes when working memory is
updated (Polich, 1993). A similar developmental speeding was found for
theta response latency, although it preceded P400-700 peaking by approximately
200 ms. The present results further indicate that there is a strong relationship
between the theta response latency and the latency of P400-700, such that
theta response latency was entirely responsible for the age-related reduction
of P400-700 latency. It is to be emphasized that a developmental latency
reduction was not observed for N1, P2, N2, and P330, and no correlations
with P400-700 latency were obtained by analysis in the time domain. Also,
P400-700 and theta response latencies did not correlate with reaction times.
These findings suggest that the developmental acceleration of the processes
reflected by P3b is driven by speeding in the preceding processes in the
theta frequency channel. Because event-related synchronization (enhancement)
of theta activity has been associated with episodic memory activation (Klimesch
et al., 1994, 1996), and P300 latency has been related to memory span development
(Howard and Polich, 1985; Polich et al., 1990), the present result may
reflect the maturation and improvement of memory functions.
5. Conclusion
The results of the present study indicate that:
(1) Theta system of the brain undergoes important changes from childhood
to adulthood such that the maximal response occurs with less delay after
stimulation. (2) There is a strong association between theta response
latency and the latency of late endogenous P300 wave of ERPs in children
such that the developmental reduction in P300 latency can be predicted
by age variations in the theta response latency. Taken together, these
results demonstrate that the brain theta response is related with cognitive
stimulus processing and also that developmental speeding of P300-related
processes appears to be due to a decrease in latency of the preceding theta-band-related
processes. Thus, a new evidence is provided from a developmental point
of view about the functional relationship between the endogenous P300 wave
of the ERPs and theta response of the brain.
Acknowledgements
This work was supported by the National Scientific
Research Fund at the Ministry of Education, Science, and Technologies,
Sofia, Bulgaria and the Deutsche Forschungsgemeinschaft, Bonn, Germany
(Contr. 436-BUL-113/76). Special thanks are due to Dr. John Polich for
most helpful comments, discussions, and support.
References
Basar, E. (1980) EEG Brain Dynamics. Relation between EEG and Brain
Evoked Potentials. Elsevier, Amsterdam.
Basar, E. (1992) Brain natural frequencies are causal factors for resonances
and induced rhythms. In: E. Basar and T. H. Bullock (Eds.), Induced
Rhythms in the Brain. Birkhäuser, Boston, pp. 425-467.
Basar, E. and Bullock, T.H., Eds. (1992) Induced Rhythms in the Brain.
Birkhäuser, Boston.
Basar, E., Hari, R., Lopes da Silva, F.H. and Schürmann, M., Eds.
(1997). Brain Alpha-Activity - New Aspects and Functional Correlates, International
Journal of Psychophysiology, Vol. 26, Special issue.
Basar-Eroglu, C., Basar, E., Demiralp, T. and Schürmann, M. (1992)
P300-response: possible psychophysiological correlates in delta and
theta frequency channels. A review. Intern. J. Psychophysiol., 13:
161-179.
Basar-Eroglu, C., Kolev, V., Ritter, B., Aksu, F. and Basar, E. (1994)
EEG, auditory evoked potentials and evoked rhythmicities in three-year-old
children. Intern. J. Neuroscience, 75: 239-255.
Courchesne, E. (1983) Cognitive components of the event-related potential:
changes associated with development. In: A.W.K. Gaillard and W. Ritter
(Eds.), Tutorials in Event-Related Potential Research: Endogenous
Components. North-Holland, Amsterdam, pp. 329-344.
Courchesne, E. (1990) Chronology of postnatal human brain development:
Event-related potential, positron emission tomography, myelinogenesis,
and synaptogenesis studies. In: J.W. Rohrbaugh, R. Parasuraman and
J. Johnson, Jr. (Eds.), Event-Related Potentials: Basic Issues and
Applications. Oxford University Press, Oxford, pp. 210-241.
Davis, A. (1973) Power spectral analysis of flash and click evoked responses.
Electroenceph. clin. Neurophysiol., 35: 287-291.
Demiralp, T. and Basar, E. (1992) Theta rhythmicities following
expected visual and auditory targets. Intern. J. Psychophysiol., 13:
147-160.
Donchin, E. and Coles, M.G.H. (1988) Is the P300 component a manifestation
of context updating? Behavioral and Brain Sciences, 11: 357-374.
Duncan-Johnson, C.C. and Donchin, E. (1979) The time constant in P300
recording. Psychophysiology, 16: 53-55.
Fuster, J. (1991) The Prefrontal Cortex, Anatomy, Physiology and Neuropsychology
of the Frontal Lobe. Raven Press, New York.
Gasser, T. Bächer, P. and Möcks, J. (1982) Transformations
towards the normal distribution of broad band spectral parameters of the
EEG. Electroenceph. clin. Neurophysiol., 53: 119-124.
Gasser, T., Verleger, R., Bächer, P. and Sroka, L. (1988) Development
of EEG of school-age children and adolescents. I. Analysis of band power.
Electroenceph. clin. Neurophysiol., 69: 91-99.
Goldman-Rakic, P. (1988) Topography of cognition: Parallel distributed
networks in primate association cortex. Ann. Rev. Neurosci., 11:
137-156.
Goodin, D., Squires, K., Henderson, B. and Starr, A. (1978) Age-related
variations in evoked potentials to auditory stimuli in normal human subjects.
Electroenceph. clin. Neurophysiol., 44: 447-458.
Howard, L. and Polich, J. (1985) P300 latency and memory span development.
Developmental Psychology, 21: 283-289.
Inouye, T., Shinosaki, K., Iyama, A., Matsumoto, Y. and Toi, S. (1994)
Moving potential field of frontal midline theta activity during a mental
task. Cognitive Brain Research, 2: 87-92.
Intriligator, J. and Polich, J. (1994) On the relationship between background
EEG and the P300 event-related potential. Biol. Psychol., 37: 207-218.
Intriligator, J. and Polich, J. (1995) On the relationship between EEG
and ERP variability. Int. J. Psychophysiol., 20: 59-74.
John, E.R., Ahn, H., Prichep, L., Trepetin, M., Brown, D. and Kaye,
H. (1980) Developmental equations for the electroencephalogram. Science,
210: 1255-1258.
Kalcher, J. and Pfurtscheller, G. (1995) Discrimination between phase-locked
and non-phase-locked event-related EEG activity. Electroenceph. clin. Neurophysiol.,
94: 381-384.
Katada, A., Ozaki, H., Suzuki, H. and Suhara, K. (1981) Developmental
characteristics of normal and mentally retarded children's EEGs. Electroenceph.
clin. Neurophysiol., 52: 192-201.
Klimesch, W., Schimke, H. and Schwaiger, J. (1994) Episodic and semantic
memory: an analysis in the EEG theta and alpha band. Electroenceph.
clin. Neurophysiol., 91: 428-441.
Klimesch, W., Doppelmayr, M., Russeger, H. and Pachinger, Th. (1996)
Theta band power in the human scalp EEG and the encoding of new information.
Neuroreport, 7: 1235-1240.
Kolev, V. and Schürmann, M. (1992) Event-related prolongation of
induced EEG rhythmicities in experiments with a cognitive task. Intern.
J. Neuroscience, 67: 199-213.
Kolev, V., Basar-Eroglu, C., Aksu, F. and Basar, E. (1994a) EEG rhythmicities
evoked by visual stimuli in three-year-old children. Intern. J. Neuroscience,
75: 257-270.
Kolev, V., Yordanova, J. and Silyamova, V. (1994b) The relation between
the endogenous P3 wave and evoked frequency components in children. J.
Psychophysiol., 8: 277.
Kurtzberg, D., Vaughan, H., Jr., Courchesne, E., Friedman, D., Harter,
M.R. and Putnam, L. (1984) Developmental aspects of event-related potentials.
Ann. New York Acad. Sci., 425: 300-318.
Kutas, M., McCarthy, G. and Donchin, E. (1977) Augmenting mental chronometry:
The P300 as a measure of stimulus evaluation time. Science, 197:
792-795.
Ladish, C. and Polich, J. (1989) P300 and probability in children. J.
Exp. Child Psychol., 48: 212-223.
Lang, M., Lang, W., Diekmann, V. and Kornhuber, H.H. (1989) The frontal
theta rhythm indicating motor and cognitive learning. In: R. Johnson,
Jr., J. Rohrbaugh and R. Parasuraman (Eds.), Current Trends in Event-related
Potential Research. Electroenceph. clin. Neurophysiol., Suppl. 40, Elsevier,
Amsterdam.
Luria, A.R. (1973) The frontal lobes and the regulation of behavior.
In: K.H. Pribram and A.R. Luria (Eds.), Psychophysiology of the Frontal
Lobes, Academic Press, New York, pp. 3-26.
Matouek, M. and Petersén, I. (1973) Frequency analysis of the
EEG in normal children and in normal adolescents. In: P. Kellaway
and I. Petersén (Eds.), Automation of Clinical Electroencephalography.
Raven Press, New York, pp. 75-102.
Matthis, P., Scheffner, D., Benninger, Chr., Lipinski, Chr. and Stolzis,
L. (1980) Changes in the background activity of the electroencephalogram
according to age. Electroenceph. clin. Neurophysiol., 49: 626-635.
McGillem, C.D. and Aunon, J.I. (1987) Analysis of event-related potentials.
In: A. Gevins and A. Rémond (Eds.), Methods for analysis of
brain electrical and magnetic signals. EEG Handbook (revised series, 1),
Elsevier, Amsterdam, pp. 131-169.
Mecklinger, A., Kramer, A. and Strayer, D. (1992) Event-related potentials
and EEG components in a semantic memory search task. Psychophysiology,
29: 104-119.
Miller, R. (1991) Cortico-Hippocampal Interplay and the Representation
of Contexts in the Brain. Springer, Berlin-Heidelberg-New York.
Mizuki, Y., Masotoshi, T., Isozaki, H., Nishijima, H. and Inanaga, K.
(1980) Periodic appearance of theta rhythm in the frontal midline area
during performance of a mental task. Electroenceph. clin. Neurophysiol.,
49: 345-351.
Mizuki, Y., Takii, O., Nishijima, H. and Inanaga, K. (1983) The relationship
between the appearance of frontal midline theta activity (FmQ) and memory
function. Electroenceph. clin. Neurophysiol., 56: 56-56.
Mullis, R.J., Holcomb, P.J., Diner, B.C. and Dykman, R.A. (1985) The
effects of aging on the P3 component of the visual event-related potential.
Electroenceph. clin. Neurophysiol., 62: 141-149.
Mussen, P.H., Conger, J.J., Kagan, J. and Huston, A.C. (1987) Development
of child personality. In: A.M. Fonareva (Ed.), Development of child
personality. Progress, Moscow, pp. 142-150 (in Russian).
Niedermeyer, E. (1993) Maturation of the EEG: Development of waking
and sleep patterns. In: E. Niedermeyer and F. Lopes da Silva (Eds.),
Electroencephalography: Basic Principles, Clinical Applications and
Related Fields. Williams and Wilkins, Baltimore, pp. 167-191.
Pantev, C., Elbert, T. and Lütkenhöner, B., Eds. (1994) Oscillatory
Event-Related Brain Dynamics. Plenum Press, New York.
Parvin, C., Torres, F. and Johnson, E. (1980) Synchronization of single
evoked response components: Estimation and interrelation of reproducibility
measures. In: G. Pfurtscheller, P. Busser, F. Lopes da Silva and
H. Petsche (Eds.), Rhythmic EEG Activities and Cortical Functioning, Elsevier,
Amsterdam, pp. 203-217.
Petersén, I. and Eeg-Olofsson, O. (1971) The development of the
electroencephalogram in normal children from the age of 1 through 15 years.
Neuropädiatrie, 3: 247-304.
Pfurtscheller, G., Steffan, J. and Maresch, H. (1988) ERD mapping and
functional topography: temporal and spatial aspects. In: G.
Pfurtscheller and F.H. Lopes da Silva (Eds.), Functional brain imaging,
Huber, Toronto, pp. 117-130.
Piaget, J. (1969) Psychology of intellect. In: Selected psychological
studies. Moscow, pp. 55-232 (in Russian).
Picton, T.W. (1992) The P300 wave of the human event-related potential.
Journal of Clinical Neurophysiology, 9: 456-479.
Polich, J. (1986) Attention, probability, and task demands as determinants
of P300 latency from auditory stimuli. Electroenceph. clin. Neurophysiol.,
63: 251-259.
Polich, J. (1990) P300, probability, and interstimulus interval. Psychophysiology,
27: 396-403.
Polich, J. (1993) P300 in clinical applications: meaning, method,
and measurements. In: E. Niedermeyer and F.H. Lopes da Silva (Eds.),
Electroencephalography: Basic Principles, Clinical Applications,
and Related Fields, (3rd ed.). Williams & Wilkins, Baltimore, pp. 1005-1018.
Polich, J., Howard, L. and Starr, A. (1983) P300 latency correlates
with digit span. Psychophysiology, 20: 665-669.
Polich, J., Ladish, C. and Burns, T. (1990) Normal variation of P300
in children: age, memory span, and head size. Intern. J. Psychophysiology,
9: 237-248.
Pritchard, W.S. (1981) Psychophysiology of the P300. Psychological Bulletin,
89: 506-540.
Rothenberger, A. (1990) The role of frontal lobes in child psychiatric
disorders. In: A. Rothenberger (Ed.), Brain and Behavior in Child
Psychiatry. Springer, Berlin-Heidelberg, pp. 34-58.
Röschke, J., Mann, K., Riemann, D., Frank, C. and Fell, J. (1995)
Sequential analysis of the brain's transfer properties during consecutive
REM episodes. Electroenceph. clin. Neurophysiol., 96: 390-397.
Ruchkin, D. (1988) Measurement of event-related potentials: Signal
extraction. In: T. Picton (Ed.), Human Event-Related Potentials,
Handbook of EEG (revised series, 3), pp. 7-43.
Sayers, B.McA., Beagley, H.A. and Henshall, W.R. (1974) The mechanism
of auditory evoked EEG responses. Nature, 247: 481-483.
Schürmann, M. and Basar, E. (1994) Topography of alpha and theta
oscillatory responses upon auditory and visual stimuli in humans. Biol.
Cybern., 72: 161-174.
Schürmann, M., Basar-Eroglu, C., Kolev, V. and Basar, E. (1995)
A new metric for analyzing single-trial event-related potentials. Application
to human visual P300 delta response. Neurosci. Lett., 197: 167-170.
Solodovnikov, V.V. (1960) Introduction to the Statistical Dynamics of
Automatic Control Systems. Dover, New York.
Stampfer, G.H. and Basar, E. (1985) Does frequency analysis lead to
better understanding of human event-related potentials. Intern. J. Neuroscience,
26: 181-196.
Verleger, R. (1995) Memory-related EEG potentials: slow negativities,
priming positivity, recognition positivity, and Dm. PSYCOLOQUY 6(27) memory-brain.3.verleger.
Wastell, D.G. (1979) The application of low-pass linear filters to evoked
potential data: filtering without phase distortion. Electroenceph.
clin. Neurophysiol., 46: 355-356.
Wickens, C., Kramer, A., Vanasse, L. and Donchin, E. (1983) Performance
of concurrent tasks: A psychophysiological analysis of the reciprocity
of information-processing resources. Science, 221: 1080-1082.
Woody, C.D. (1967) Characterization of an adaptive filter for the analysis
of variable latency neuroelectric signals. Med. Biol. Eng., 5: 539-553.
Yamaguchi, Y. (1981) Frontal midline theta activity. In: N. Yamaguchi
and K. Fujisawa (Eds.), Recent Advances in EEG and EMG Data Processing,
Elsevier/North-Holland Biomedical Press, Amsterdam, pp. 391-396.
Yordanova, J., Kolev, V. and Silyamova, V. (1994) Evoked theta rhythmicities
in children in passive and task conditions. J. Psychophysiol., 8:
376.
Yordanova, J. and Kolev, V. (1996) Brain theta response predicts P300
latency in children, NeuroReport, 8: 277-280.
Yordanova, J. and Kolev, V. (1998). A single sweep analysis of the
theta frequency band during auditory oddball task. Psychophysiology, 35:
116-126.
Yordanova, J. and Kolev, V. (in press) Developmental changes in the
theta response system: a single sweep analysis, J. Psychophysiol.
Electroencephalography and clinical Neurophysiology
EEP 96687