Latimer,
C. and Gazzard, S. (1998, in press): Modelling Attentional Biases in the
Perception of Geometric Forms. In T. Downs and M. Gallagher: Proceedings
of the Ninth Australian Conference on Neural Networks (ACNN, '98).
Modelling Attentional Biases in the Perception of Geometric Forms.
Modelling Attentional Biases in the Perception of Geometric
Forms.
Cyril Latimer and Scott Gazzard
Department of Psychology
University of Sydney
email: cyril@psych.usyd.edu.au
Abstract
Attentional biases are observed in all modalities of human perception.
For example, experimental participants respond more quickly to particular
dimensions of stimuli and to stimuli located in particular positions of
the visual and auditory fields. This paper reports robust top-right attentional
bias in perception of simple geometric forms and an explanation of this
bias in terms of our long experience at reading English text from left
to right coupled with the need to adjust attention upwards as we locomote
through visual space. Attempts to explain the attentional bias in terms
of simple neural networks given training at recognising features scrolling
from right to left and top to bottom in the visual field are reported.
1. Attentional Biases
Attentional biases occur in all modalities. Not only do humans show
a preference for processing higher rather than lower frequencies, but they
also display a propensity for processing higher frequencies in the right
ear [1]. In the visual domain, it is easy to ignore an irrelevant attribute
if it is a colour, but not if it is a word - the Stroop Effect [2]. When
large alphabetic characters are composed by smaller and different characters,
recognition of the larger letters has an interfering effect on recognition
of the smaller letters but not vice versa [3]. Biases for particular regions
of the visual field and for particular regions within visual patterns have
also been demonstrated. Eye fixations are often directed more to the top
and left of a visual array and differential performance in processing items
to top, right and left of fixation has been observed in reading and visual
form recognition. Finally, there is abundant evidence for lateral asymmetries
in perception due to the asymmetry of representation of function between
the cerebral hemispheres [4].
Latimer and Stevens observed superior performance in the perception
of simple geometric forms when differences between a standard form and
a set of comparison forms were located reliably at the top and to the right
rather than top-left, bottom-right or bottom-left [5]. Samples of 14 -
20 experimental participants were presented with the standard form on a
computer screen followed either by the standard again or a comparison form
and were asked simply to judge whether the second form was the same as
or different from the standard form. Participants responded, "Same" or
"Different" and their response times were recorded with millisecond accuracy
by way of a voice key. Forms measured 4 cms (3.06 deg.) horizontally by
5.5 cms (4.2 deg.) vertically. Figure 1 shows the stimulus sequence with
the standard form and a comparison form differing in the top-left region.
Figure 2 depicts examples of sets of comparison forms differing reliably
in the regions: top-right, bottom-right, top-left and bottom-left.
The top-right bias is robust and is in evidence even when experimental
participants are informed that the reliable region of difference is
------------------------------------------------------------------
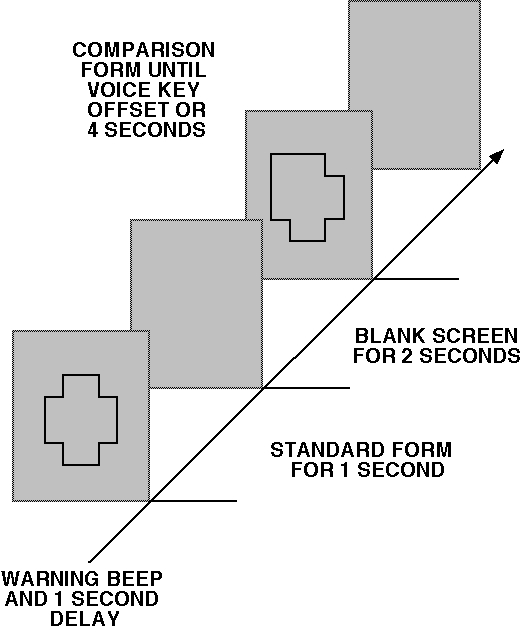
Figure 1. The stimulus sequence with the standard form and a comparison
form differing in the top-left region.
------------------------------------------------------------------
in the bottom-left and are instructed to attend bottom-left [5]. By
way of comparison Figure 2 shows the mean judgment times and standard errors
of participants for sets of comparison forms differing reliably from the
standard form in one of the four regions. It can be seen that placement
of the reliable region of difference in the top-right of the comparison
forms produces significantly faster response times. Furthermore, responses
are faster when differences are located to the right rather than the left
of the comparison forms.
------------------------------------------------------------------
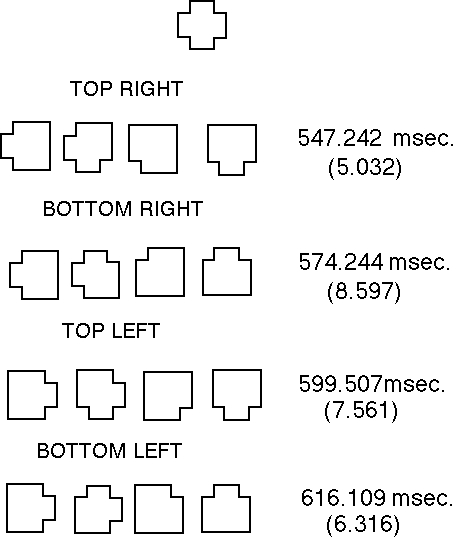
Figure 2. Standard form and sets of comparison forms with mean judgment
times and standard errors (in brackets) for each set of comparisons.
------------------------------------------------------------------
2. Explanations of the Bias
One possible explanation of the top-right superiority is the combined
influence of our considerable experience at reading English from left to
right coupled with our experience at continually adjusting our gaze upwards
as we locomote through space. When reading, we are constantly set to gather
information on the right of fixation, and as a result, our effective attentional
field may extend further to the right than to the left. Honda and Findlay
note that eye movements to the top of the visual field are faster than
those to the bottom and suggest that visual ecology may play a part here
[6]. In normal forward locomotion, the eyes often remain fixed on an object
as it moves lower in the visual field. Thus there will be a majority of
downward tracking movements of the eyes followed by frequent upward refixation
movements. If the latency of attentional shifts is affected by experience,
then it is possible that the observed top-right attentional superiority
may be engendered by a combination of predominantly rightward attentional
shifts in reading and upward attentional shifts in forward locomotion.
Accordingly, an attempt has been made to provide a mechanism for such
an explanation of the bias in terms of a simple artificial neural network
given training at recognising features scrolling onto its "retina" from
various directions. Should it prove possible to train such a network and
engender biases like those observed for human subjects, then the network
would stand as an existence proof of the possibility that the human attentional
biases may be determined by biased visual experience.
3. Network Configuration
The neural network was designed to demonstrate its operating principles
in as simple a manner as possible, while maintaining general architectural
plausibility with regard to the connection patterns found in the mammalian
visual system. Every unit in the network is a linear threshold unit with
continuous positive activation and binary output. Activation levels decay
by ten percent over each network cycle.
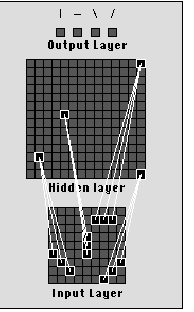
Figure 3: Network architecture with examples of connection patterns
for each type of input feature. Each output unit connects to every hidden
layer unit.
------------------------------------------------------------------
The architecture is based on a perceptron, with a 9 x 9 array of units
in the input layer, a 14 x 14 array of units in the hidden layer, and four
output units. Connections from the input layer to the hidden layer are
fixed and hard-wired so that the hidden units behave as feature detectors.
Figure 3 depicts the network architecture and shows examples of the four
types of feature available for detection - vertical, horizontal, left-diagonal
and right-diagonal lines within a 3x3 grid. For each type of feature at
every possible position on the input layer, there exists a unit in the
hidden layer dedicated to its detection.
The output layer contains one unit for each type of feature. Each output
unit is connected to every unit in the hidden layer, and weights are initially
set to a random value between 0 and 0.1. Weights on connections to the
output layer are modifiable and are updated after each cycle according
to the version of the delta rule shown in Equation [a]. Note that backpropagation
of error is not necessary for training in this network configuration.
[Delta]wij = k[alpha]i(ti-oi)ij
[a]
In Equation [a], k is a learning rate constant, [alpha]
is a weight limitation parameter, t is the target activation level,
and o is the observed activation level. The only term added to the
traditional delta rule is [alpha], which operates to keep weights
within the positive 0-1 range. Its value is given below.
if ti>oi : [alpha]i=(1-wij);
if ti<oi : [alpha]i=(wij);
if ti=oi : [alpha]I=0
.
The familiar, but noteworthy property of the delta rule in Equation
[a] is that the amount of change in connection strength applied to a particular
connection is (among other things) proportional to the difference between
an output unit's observed level of activation and its target level of activation.
This simple point becomes essential for an understanding of how the network
modifies its connections during exposure to dynamic input patterns.
4. Training procedure
The goal of network training was to associate each of the output units
with the presentation of one type of feature on the input layer at any
location. Whereas feature detection by hidden units is location-specific,
the successfully trained output units are location-independent feature
detectors. Training was conducted using the normal technique of presenting
input patterns and applying the delta rule on each presentation. The only
difference between the current procedure and traditional techniques was
that the input patterns were structured to simulate stimuli scrolling across
the network's input layer (an analogue of a retina). Five training schedules
were used to train the network on separate occasions, reflecting feature-scrolling
from right-to-left, top-to-bottom, left-to-right, bottom-to-top, and a
combination of right-to-left and top-bottom scrolling. Regardless of which
training schedule was being employed, each feature was presented at every
possible location on the input layer a total of 10 times during training.
Figure 4 shows an excerpt from the training stimulus used for the right-to-left
and left-to-right schedules. Training proceeded by presenting the pattern
formed by the 9x9 grid starting at position 1 at cycle 1, then position
2 at cycle 2, position 3 at cycle 3, and so on.
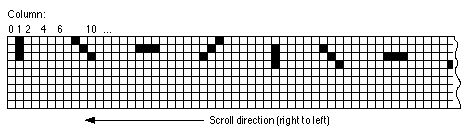
Figure 4: Excerpt from scrolling stimulus set used for right-to-left
schedule.
Results
The main focus of interest in training and testing the current network
was whether top-visual hemisphere and right-visual hemisphere response
biases recorded in human subjects would be observed as a result of training
designed to simulate 1) reading of text from left to right (right-to-left
feature-scrolling), and 2) forward locomotion in a ground-feature-intensive
environment (top-to-bottom feature-scrolling). The network was tested by
presenting individual features at each location on the input layer, and
then measuring the resultant activation level of that feature's target
output unit. Five training runs were conducted for each training schedule,
and results presented below refer to the averages across training runs.
The first training schedule employed right-to-left feature scrolling.
Figure 5 presents the results for this schedule. The graph depicts the
activation levels of target output units for the presentation of features
at each location on the input layer. Note that the input layer is a 9 x
9 array, but each feature occupies a 3 x 3 grid, so there are seven possible
horizontal and vertical positions for any feature. Figure 5 clearly shows
a trend toward higher output activations for features presented on the
right side of the input layer, regardless of feature type. A t-test was
used to determine whether responses in target output units resulting from
features presented to the left side of the input layer (columns 1-3) were
significantly lower than responses resulting from features presented to
the right side (columns 5-7).
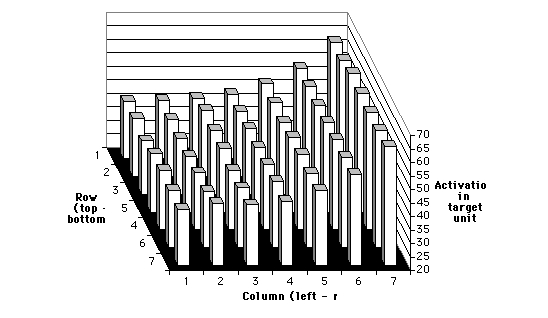
Figure 5: Results for network trained on right-to-left feature scrolling.
------------------------------------------------------------------
As can be seen in Table 1, the difference between these values was
significant. Results were obtained and tested similarly for training schedules
2, 3 and 4. Generally, the observed pattern of response strengths due to
these schedules replicated that found in Figure 5, with the trend of high
to low values always aligning with the direction of feature scrolling.
The results and significance tests for these schedules are reported in
Table 1.
The fifth training schedule combined right-to-left with top-to-bottom
feature scrolling in equal proportions. Results are graphed in Figure 6.
As expected, the results of this schedule are a superposition of trends
observed in the individual right-to-left and top-to-bottom training schedules.
The response bias is to the right and the top simultaneously.
Table 1: Mean responses to features in left, right,
top and bottom hemispheres for training schedules 1-4.
| Scroll |
Mean target response by hemisphere |
Statistics |
| direction |
Left |
Right |
Top |
Bottom |
t obs |
p value |
| right -> left |
41.74 |
54.80 |
- |
- |
-17.11 |
<0.001 |
| left -> right |
54.75 |
41.80 |
- |
- |
16.28 |
<0.001 |
| top -> bottom |
- |
- |
54.69 |
41.58 |
17.40 |
<0.001 |
| bottom->top |
- |
- |
41.80 |
54.82 |
-16.46 |
<0.001 |
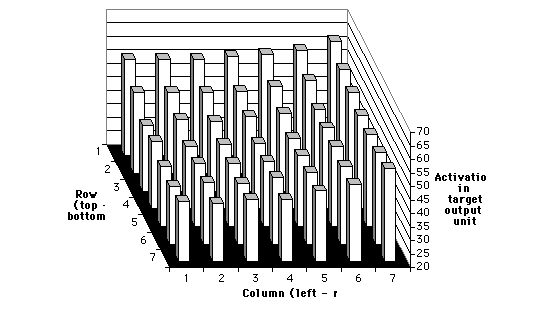
Figure 6: Results for network trained on right-to-left and top-to-bottom
feature scrolling.
------------------------------------------------------------------
To summarise, the results of Simulations 1 and 2 show that the network
is able to form separate visual-hemisphere response biases similar to those
found in human subjects, as a result of training on scrolling stimuli designed
to approximate reading and forward locomotion. The results of Simulations
3 and 4 demonstrate that the biases formed by the network are due to training
alone, and not network architecture or initial conditions. Finally, Simulation
5 results show that it is possible to form top-right visual hemisphere
biases simultaneously (as have been observed in the humans).
5. Discussion
The ability of the network to form response biases based on scrolling input
features arises from the interplay of three components: 1) the delta rule
for modifying connection strengths; 2) units with linear activation functions
and relatively slow decay rates; and 3) a hierarchy of feature detecting
units from location-specific detectors to location-independent detectors.
The use of the delta rule, as mentioned above, is important because the
amount of change in connection strengths depends upon the difference between
a target level of activation and the observed level of activation. The
fact that unit activations decay slowly means that activation in a particular
output unit will increase over time if the feature with which it is associated
is continuously presented. A feature that scrolls across an input layer
is necessarily continuously present (remembering that output units are
location-independent), so activation will tend to increase in a target
output unit as a feature moves across the input layer. Subsequently, as
the activation in the target output unit increases, the amount of learning
(in terms of weight change) that can occur decreases. So, the rate of weight
change on connections associating a feature at the beginning of its scroll
across the input array is therefore higher than the rate of learning for
connections associating a feature at the end of its scroll-path. When connection
strengths are increasing, the net result is that stronger associations
are formed between the feature-independent (output layer) feature detectors
and the location-specific (hidden layer) feature detectors located where
features first appear when they scroll across the input array.
In simple terms, stronger associations and higher activation of units
in the top-right visual field would translate into faster response times
to geometric forms whose reliable regions of difference from a standard
form lie in the top-right corner [7]. As a result, the network stands as
an existence proof of a mechanism that can acquire through experience a
sufficient basis for responding relatively more quickly to differences
falling within its top-right visual field. Further research is needed to
determine whether or not similar principles determine the robust, visual
attentional biases observed in human experimental participants.
Acknowledgments
This research was supported by an ARC Institutional Grant to the first
author.
6. References
[1] D. Deutsch, "Grouping mechanisms in music". In D. Deutsch (Ed.),
The psychology of music New York: Academic Press. 1982
[2] J.R. Stroop, J. R " Studies of interference in serial verbal reactions".
Journal of Experimental Psychology, vol 18, 643-662, 1935
[3] D. Navon, D, "Forest before trees: The precedence of global features
in visual perception". Cognitive Psychology, vol 9, 353-383, 1977
[4] M. Corballis, The lopsided ape: Evolution of the generative
mind. New York: Oxford University Press, 1991
[5] C.R. Latimer, C.J. Stevens, L. Webber & S. Gazzard, Attentional
biases in geometric form perception. manuscript under review.
[6] M. Honda, H., & J.M. Findlay, Saccades to targets in three
dimensional space: Dependence of saccade latency on target location. Perception
& Psychophysics, vol 52, 167-174, 1992
[7] C.R. Latimer, W. Joung, & C.J. Stevens Modelling symmetry detection
with back-propagation networks. Spatial Vision, vol 8, 1-17, 1994