

DURING A LEARNING TASK
M F El-Bab and E M Sedgwick
Clinical Neurological Sciences, University of Southampton,
U.K
Abstract
Event related potentials (ERPs) were recorded from 25 scalp electrodes in 44 normal subjects, aged 21 to 34 years.
Our aim was to determine whether there was a difference in brain potentials in those did learn (successful learners), compared to those who did not (unsuccessful), and a control group (Observers).
The subjects viewed computer generated patterns of two types A and B. Feedback of ‘right’ or ‘wrong’ was given to them as soon as they made decision. Clues from border effects or contrast change were eliminated. Each subject had 200 trials and
18 subjects learned to perform better than 70%, 16 did not. A control group observer patterns without attempting learning. Both groups attempting to learn showed a long duration late positivity which was not seen in those who simply observed the patterns. The non-learners showed the same degree of positivity when comparing the first 50 trials with the last 50. The learners showed an even greater positivity during the correct answers in the last 50 trials, when they had learned the difference, compared with the nonlearners.
The learning process is associated with scalp positivity, which was distributed frontally and appeared slightly greater over the right hemisphere. An additional finding was that the learners made quicker decisions to each trial than the non-learners did
INTRODUCTION
The word cognitive comes from the Latin word "cognoscere", meaning to know. Learning and memory are different sides of the same coin. Memories are what left behind as a result of learning, and we infer the existence of learning from the presence of memories. Scalp recording of non-invasive event related potentials (ERPs) have been proven to be useful, powerful, and more direct approach to study the human cognitive, memory, and learning processes. The first waveforms are that of the N100 and P100, which represent the physiological action of the visual system. The P100 represents the visual cortical activity.
First of three components in visual discrimination tasks is mainly posterior
N200 wave and has been named ‘selection negativity’. It has been shown
to increase in amplitude to task deviant stimuli. Secondly an anterior
postivity to task related stimuli occurs around 200 msecs its behaviour
is to increase to correctly recognised stimuli. Both the selection negativity
and The P200 are dependent on the on-line processes that identify relevant
visual features. The third component is the N400, which thought to be correlate
of stimulus categorisation or orientation and increased by task relevant
deviant stimuli. (Czigler, 1995). The P300 is a cognitive late positive
complex of event related potentials (Garcia-larrea et al 1998), and elicited
by simple visual discrimination task and has been used as an electrophysiological
index of cognitive functions (Ravden and Polish, 1998). The P3-like waveforms
can obtain with passive procedures that do not demand an active intentional
discrimination (Polish, et al 1993). Correct and incorrect feedback considered
as indications to a learner about subject’s previous response. Since 1972
the researchers have been start to study the subjects’ performance and
ERPs accompanying feedback. They conclude that the feedback provides informations
relevant to past behaviour which may be used to modify behaviour in the
future trials (Jenness 1972; Poon et al. 1974; Johnson and Dochin 1978,
1982, 1985; Stuss and Picton 1978; Perrault and Picton 1980; Ruchkin et
al. 1980, 1981, 1982; Stuss et al. 1980; DeSwart et al. 1981; DeLisle et
al. 1986; Papkostopoulos et al.1986; Warren and McDonough 1995). In the
present study our aims were to develop a learning task in which some people
learnt and some people didn’t. Combining electrophysiological and behavioural
measures of participants’ brain activity while they were performing that
learning task. The cognitive area and especially the late positive waves
were our interest.
SUBJECTS AND METHODS
34 young adult volunteers aged 21:34 years (15 females), performed the test. Ten subjects passively observed the screen (control group). Ethical approval obtained from the local hospital ethical committee and informed consent obtained from all subjects. All of the right handed as indicated in a chart of Edinburgh Handedness inventory (Oldfield. 1971), and as defined by repeated writing hand, and all had normal or corrected to normal vision, a brief tour of the laboratory given to all of them. Ethical approval obtained and informed consent taken from all the subjects.
Subjects were seated comfort in front of a computer monitor (IBM 14 inch) in isolated room, temperature controlled.
Typical learning trial proceeded as follows (Figure 1), and observers trial (Figure 2). For each session the subject was presented with 200 random images. Image exposure was for 2000 msec followed by 500 msec blank grey screen. Each image is made from a random arrangement of 40 x 32 letter-like elements of four different forms. There was no overall luminance change. The order of the elements in each field is randomly distributed, but randomness follows certain rules. The outer 3 rows and columns are always the same, consisting of a random mixture containing 25 % of each of the individual elements. Border around the edge of each image is elements wide, and doesn’t change from are image to the next. The centre of the display field is either of two types A and B images contain 12.5 % more or less of one of the elements (Figure 3).
Subject made a single response to each image as soon as they made them
decision within the image display time followed by right and wrong feedback
on the screen. The same images number (200), and patterns (A & B) were
displayed for the control group. Were just asked to watch the screen without
either decision making or pressing buttons.
RECORDING
Subjects had an cap electrodes (Electro-cap international) on their
head hold 25 tin electrodes sites with low resistance to the current flow,
good polarisation characteristics, fitted to the cap by plastic rings and
connected to the head box by one-meter length cable. Were designed by NASA
in America and made of elastic fabric which easily fit the geometry of
the head, available in different sizes, large 58-62 cm head circumference,
medium 54-58 cm head circumference, and small 46-50 cm head circumference.
To insure the correct size of the cap, we had measured the subject head
circumference with tape measure, and then the cap pulls over the head and
is fixed by two elastic straps from both sides to around the subject chest
built. The gap between the electrodes and the skin was bridged by a high
conductivity, non-saline electrode gel (Electro-gel), after the skin was
slightly scratched using a blunt needle. The locations for these electrodes
include all the standard international 10-20 system location (Jasper, 1958).
Additional scalp derived sites along with some electrodes fixed to the
cap in appropriate positions, these sites were employed in a pattern previously
used in ERPs language studies. (Holcomb, and McPherson 1994; Holcomb, 1993;
Holcomb & Neville, 1991). Left and right temproparietal TPL & TPR
which were over the Wernicke’s area and its right hemisphere homologue
( WL - WR 30 % of intra-aural distance. Lateral to point 13% of the nasion-inion
distance posterior to CZ. Left and right anterior temporal ATL & ATR
50% of the distance between T3/T4 and F7/F8. Two midline sites. OZ 10%
of the inion-nasion distance. FPZ 10 % 0f the nasion-inion distances. These
electrodes were concentrated over the areas of interest, the frontal, the
parietal, and the temporal Four electrodes were affixed with surgical tape
and were filled with Elector-gel for monitoring the eye movement artefact,
and blinking. The first two (VEOG) beneath and above the left or the right
eye to check for eye blinks and vertical movements, and the other two (HEOG)
was placed to the lateral side of the subject right and left eye to check
the horizontal or the lateral movement. All these sites were referenced
to the linked left & right mastoid processes. The impedance between
each recording site and reference was reduced to below 5Kohms.
EQUIPMENT :
The Electro-cap and all others electrodes were connected to the thirty-two
channels head box. Contains the first stage of amplification to reduce
the effect of noise encountered during conduction into the main amplifier.
The signals pass by shielded cable to be amplified 10K by a the SynAmps
DC amplifiers containing analogue components needed to amplify the low
level signals and analogue-to-digital converter (ADC) need to covert the
analogue signals to digits for further processing, and controlled by NeuroScan
3.0 (386 version) software model 5083. EEG in personal computer, and linked
to coloured printer and storage units, amplifier filter band pass was 0.03-30.0
HZ. The EEG was digitised at 4 ms per point for 625 points and time-locked
to stimulus presentation. This gave individual epoch recording from -500
msec. to 2000 msec. Thus a 2500 msec recording. With 500 msec pre-stimulus
baseline. Sweeps in which the EEG exceeded ±
70m n were manually
rejected, baseline correction between -200 ms. and 0 ms. was applied to
individual average files. the raw EEG was averaged and stored on GATEWAY2000
computer hard disc.
BRAIN MAPPING
The goal of the brain mapping is to isolate local neural activity associated
with sensory, motor, and cognitive functions. The current flow either into
or out of a cell through charged neuronal membranes generate the ongoing
EEG. The EEG recorded at the scalp is largely attributable to graded postsynaptic
potentials (PSPs) of the cell body and large dendrites of vertically oriented
pyramidal cells in cortical layers three to five (Lopes da Silva, 1991).
These synaptic potentials are of much lower voltage than action potentials,
but they also last much longer and involve a larger amount of surface area
on cellular membranes and, as a result, the extracellular current floe
produced by their generation has a relatively wide distribution. Several
factors determine the degree to which a cortical potential will be recordable
at the scalp, including the amplitude of the signal at the cortex, the
size of a region over which PSPs are occurring in a synchronous fashion,
the proportion of cells in that region which are in synchrony, the location
and orientation of the cells in relation to the scalp surface, and the
amount of signal attenuation and spatial smearing produced by conduction
through the intervening tissue layers of the dura, skull, scalp. PSPs are
thought to be synchronised by rhythmic discharge from thalamic nuclei (Lopes
Da Silva, 1991), with the degree of synchronisation of the underlying cortical
activity reflected in the amplitude of the EEG recorded at the scalp. The
NeuroScan 3.0, which include WINDOW program topographic mapping package
in colour or black and white, can map the averaged sweeps or single sweep
of the recording data. this technique of the topographic mapping for displaying
the waveform data from large multi-electrode arrays. The results are a
multicolour surface that represents the scalp distribution of voltage.
The cartoon series of small maps each corresponding to a short segment
of large time window from the averaged waveform and show evolution of potentials.
The potentials were studied by using the top view, right view, and left
view. The scale is always shown to the right hand side of the brainmap
figures, in the form of colour intensity gradient. Brain activities can
be highlighted in different scale because these maps depend on the potentials
scale factor. Maps show spatial and temporal changes, but the comparison
is qualitative rather than quantitative, and it is useful method for combining
the information from multi-channel recording.
STATISTICAL ANALYSIS:
We have averaged for both groups learners and non-learners, all sweeps, correct & incorrect responses sweeps, and first & last 50 sweeps, the ERPs were measured, quantified & compared by calculating the mean amplitudes during two time windows. The first time window 250 msecs to 550 msecs and the second time window 550 msecs to 850 msecs.
Then the data exported to the statistical package for the social sciences (SPSS) for statistical procedure, the latency and amplitude were analysed by using summarise, descriptive procedures, and the data expressed in mean, minimum, maximum, and standard deviation. The means were compared by Independent samples & paired T-test for within group, and repeated measures ANOVA-models with different independent variables for whole averaged sweeps in both groups.
Latency and amplitude increase and decrease were studied and assessed by inspection through the event related potentials waves morphology (positive and negative deflections), comparison was made between the averaged all sweeps, correct & incorrect responses sweeps, first & last 50 sweeps, and right and left side sweeps too.
The subjects reaction time for all, first 50, last 50, correct, incorrect,
type A, and type B were quantified and compared by calculating the mean,
maximum value, minimum value, and standard deviation, in both groups (learners
and non-learners), after the subjects performance logging (text) files
were exported to the Statistical Package for the Social Sciences (SPSS).
Then Means have been compared Independent-sample t-test for within group.
RESULTS
15 females (22.5 ± 3.4 years) and
19 males (23.5 ± 3.7 year) participate
in this study. There was no significant difference (F=….., P = …) between
the group mean age of females and males subjects.
Performance
Change over the first fifty and last fifty (before and after learning) of the task and it’s difficulty were evaluated by using a repeated measure ANOVAS (Dixon et al 1990; Warren et al 1994). The cut off for learning was set at ³ 70% correct for the last fifty answers have been used to assess the subject’s performance. and it’s profile was divided into two categories, the first one subject reflecting satisfactory progress or better (learners, n=18) and the second one subject considered unsatisfactory (non-learners, n=16).
The learners performance error was significantly greater for the first versus the last trials of the task (…..vs…..: F( / ) =…., …. ; P = ….), but was significant for the non-learners. The Mean performance error was greater for the non-learners (…) when compared with the learners group (…) in the last fifty trials (F( / ) =…., …. ; P = ….).
The finding that there is no difficulty difference between pattern A and B, and that did not affect the behavioural performance, which was not also reflect on the error rate…. % of the pattern A, whereas the error rate was ..% for pattern B.
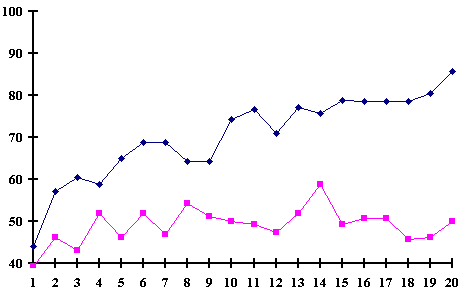
The learning curve by visual inspection showed that all subjects have relatively poor performance at the beginning of the trials, then the learners had better performance after the first fifty (Figure 4). Learner’s performance shows steady increase, and as expected the non-learners were struggling to achieve the required success, but they exhibited no start to finish difference.
There were some subjects in the non-learning group seem that they had got the difference in the middle of the trial and they were able to identify between both patterns, but they lost that again. Different subject’s character in the learning group who was not able to identify the difference between both patterns (A&B), but by the end of the trials he got the clue.
The subjects performed three responses correct, incorrect, and no response.
A clear divide was seen. Two learners performance only were ³
70%, three non-learners were over ³ 50%,
and non-of them was ³ 60% (Figure
5).
DECISION TIME
In the learning group decision time significantly decreased during learning, but increased for Non-learners (Figure 6).
Decision time was longer for incorrect answers, and first fifty answers in both groups.
The decision time tended to be similar in the learners group for type
A and type B, and it is shorter for type B in the non-learners group.
EVENT RELATED POTENTIALS
We Grand averaged the learners (n = 18) and the non-learners (n = 16) all, first fifty, last fifty, correct, and incorrect answers sweep.
The first time window 250 msecs to 550 msecs and the second time window 550 msecs to 850 msecs.
The ERP graphs show a timeline of the average brain activity in all electrodes.
The Y-axis is measuring the activity in MicroVolts; the X-axis is time scale from -500 to 2000 msecs.
We found that the prestimulus baselines of the waveforms are very similar, and the sensory portions of the waveforms are similar too. Observers showed less positivity than those who trying to learn. The ERP waves begin to change at 250 msecs and show marked differences from 300 msecs -- 800 msecs. There is increase in the positivity occurring from 300 msecs onwards in all trial displays in the learning group, and there is less positivity for the group of non-learners. In the case of the observers group, the ERPs waves appear to be close to the baseline throughout the test (Figure 8).
There are highly significant differences of the P300 waveform amplitude
between the learners and non-learners, and between both of these two groups
and the observers group during the two time windows (Figure
9).
We are comparing the first 50 of the 200 images with the last fifty
of these images. In the first fifty we expect they are guessing, as they
have not had the chance to learn yet and the last 50 if we can assume that
they either have or have not learned. If the subject has learnt to distinguish
the two stimuli you would suspect the neurophysiological processes from
the start to end answers waves and correct to incorrect answers waves to
be different.
A deviation in cognitive evoked potential can be seen from 200 msecs to 900 msecs in the case of learners group (Figure 10).
In the group of learners start to end (before and after learning), it does appear to be different with increase in the positivity occurring from 200 msecs onwards in the last fifty displays (Figure 11). Whereas in the case of non-learners group, the activity appears to be similar throughout the test (Figure 12).
In the learners ERPs correct to incorrect answers, seem to be different with a very clear increase in the positivity for the correct answers. These cognitive deviations start at 200 msecs and end about 1200 msecs. The mean amplitude differences are highly statistically significant during both time windows (Figure 13). For the non-learning group look similar to each other (Figure 14).
The complementary pattern used as stimuli, although forming two categories, was very similar visually. This sensory VEP and the cognitive portion of the ERP waves show that processes evoked by either pattern are similar in the both groups. -Learners and non-learners- (Figure 15).
The right hand side electrodes were compared to the left hand side electrodes in the learning group during last fifty answers, Central area C4-C3, Frontal area F4-F3 & F8-F7, and Parietal area P4-P3 during the two time windows (Figure 16; Table 1). In the non-learning group there is no statistical significant electrodes site results at all (Table 2).
A brainmap shows the difference between learners (Figure 17a) and non-learners (Figure 17b) the frontal midline region.
The ERP waves subtraction for learning group, and the non-learning group,
minus the observers group (Figure
18). The brainmap waves subtraction for the learner group minus the
non-learners during the two time windows. (Figure
19). This increased P300 during learning correlate with our hypothesis
that there is a difference in brain activity as a result of learning.
DISCUSSION
Our aims of this study, to look for the change in cognitive event related potentials, at the beginning and at the end, and at the correct & incorrect answers, of learning task in which subjects learnt and did not, to examine the decision time, and subjects performance. There is no literature that correlates all of these data in one set of participants.
BEHAVIOURAL
The ideal subjects seemed to be a moderately motivated and competitive individual.
During de-briefing, motivation and function seemed to contribute to performance, certain individuals appear to be over competitive or to try too hard resulting incorrect answers provoking frustration.
The non-learner group seemed under motivated and they didn’t want to be there, were thinking of other things and couldn’t focus on the task.
Learning process appeared to go through three phases:
Subjects were guessing, resulting in 50% performance and string of three or four similar answer at most.
Subjects’ tactics were to compare and distinguish between the past image and the present pattern on the screen.
Learners constructed a more robust model and have associated the patterns to an individual mouse button depend on the previous answers. Non-learners either stayed in stage 2 or revert to stage 1 due to frustration or surrender.
Subjects employed strategies and beliefs and the classification task was at a subconscious level. Only two out of eighteen learners were close in their explanations of classification of patterns
DECISION TIME
The decision time was quicker for the learners than non-learners.
The reduction in the decision times of the learners towards the end of the trials becomes shorter as well as more accurate, suggested that knowing the answers and responding is quicker process than guessing answers.
For the correct/ and incorrect answers decision time were significantly different, for the learners not for the non-learners. That finding is in line with the findings of (Fernandez, et al 1998), that the reaction time significantly different between the correct and incorrect answers for the group with good performance, Thus learning results from tactic employed within this extra expose time of the stimuli.
The fact that the non-learners showed on improvement or correct/incorrect variance reinforced the hypothesis that, learning mechanisms effected, this increased processing speed. Corresponding with a start, and end ERPs difference, learners showed a significantly shorter decision time to non-learners at the beginning, and the end of the trial.
There were no significant differences between the subjects decision
time either in the learners group or the non-learners group for type A
and Type B patterns answers, which result in, that there is no difference
between these images structures and task hardness, and that what confirmed
by the ERPs waves. In the learners and non-learners decision time for type
A & type B there are highly significant differences result in the differences
in both group strategies and tactics.
EVENT RELATED POTENTIALS
Generally the ERP Results reflect several findings related to the impact of learning on the underlying brain circuitry.
The first and second time windows the observers did not show any positive activity. That changes in ERPs most probably related to the learning processes, and the decision-making processes in the learners and non-learners group, which is not applicable to the observers group who did not ask to learn or to make any decision.
First time window P300 is most positive in the learning group at the end of the trial, it has been associated with increase memory effects, depth of processing and comparison of stimuli. P300 has been associated with increased memory effect, depth of processing and comparisons of stimuli
The beginning of the trial for learners shows differences ERP’s of non-learners. The unique feature of this ERP is the negative peak around 700 msecs; the learner’s waves more negatives than the non-learners waves. This initial negativity could be hypothesized to be the result of a process that is essential for later learning. For example a foundation block for a robust model of learning. This would insinuate that a prediction could be made from an ERP at the beginning of the trial as to whether a subject will learn, possibly reflecting a difference in tactic involved.
After learning or for the last fifty answers waves in the learners group. P300 amplitude was larger for that group more than the non-learners, starting around 250 msecs were. Another late positive peak around 500 msecs, which give us impression that the learning processes, represents by that later positivity.
The correct answer waves in the learners group were more positive at 300msecs and 500 msecs than the incorrect answers in the learners, and the correct answers in the non-learners, result in that the more correct answers the more early positive peaks, and due to participant or learners early and correct decisions matching with the image on the screen.
P300 latency remain stable and did not change through the task which confirm that our designed patterns perception and classification were the same through the task.
Subtraction brainmaps for these ERPs show over all voltage changes starting from 300 msecs to 600 msecs. Which are related to the learning processes.
For learner, brainmaps of subtraction for start and finish ERP show a major frontal, parietal, and temporal positivity that predominantly right hand side. The subtraction for the second time window is more positive due to cumulative changes. The changes from start to finish ERP and the voltages represented by subtraction brain maps are representations of learning. No other variable can account for these results. Non-learners have been through the same task as the learners but don’t show the ERP changes.
There additional positivity in the ERPs waves after the feedback which given to the subjects by them response specially in the learners group for correct answers. Result in using the information given to the subjects by the feedback to modify them coming responses, and it is more positive in the learning group due to they expecting that feedback which are most correct most of the answers.
From data comparing the hemispheres a major difference is seen. The
right hemisphere, in conjunction with other visual and categorical perception
tasks, shows increased positivity from 300 msecs onwards. The P300 event
related potentials (ERPs) is considered to be closely related to cognitive
processes, P300 scalp latencies increase, parietal P300 scalp amplitude
decrease and the scalp potential field shift to relatively more frontal
distribution
CONCLUSION
Reaction time quicker after learning a categorical perception task compared
with before learning and in non-learning subjects. Successful learning
is associated with an increase in late positivity. No comparable changes
are seen amongst non-learner who have undertaken the same task. The P300
was increased after learning; further experiments are needed to see if
P300 amplitude decreases when the task has been already learned. The psychological
processes involved in learning can be measured by using ERPs. This technique
with task modifications could be used in the investigation of patients
with learning difficulties. The learning task set is difficult and only
about half of the subject learned. Even so, they could not express verbally
what they had learned.
References
Czigler, I., Csibra, G. and Ambro, A. Attentional processes in discriminating visual feature and the conjunction of feature: ERP results. Electroenceph. clin. Neurophysiol. Suppl. 44. 1995. 243-249.
Dixon 1990
Warren 1994
DeLisle, M., Stuss, D., and Picton, T. Event related potentials to feedback in a concept-formation task. In: W.C. McCallum, R.Zappoli, and F. Denoth (Eds.). Cerebral Psychophysiology: Studies in event related potentials. Electroenceph. Clin. Neurophysiol. Suppl. 38. Elsevier, Amsterdam, 1986; 103-105.
DeSwart-JH; Kok-A; and Das-Smaal-EA P300 and uncertainty reduction in a concept-identification task. PSYCHOPHYSIOL. 1981.18:6.619-629.
Holcomb, P. J. Semantic Priming And Stimulus Degradation– Implications For The Role Of The N400 In Language Processing. Psychophysiology, 1993, Vol.30, No.1, Pp.47-61.
Holcomb, P. J., and McPherson, W. B. Event-related brain potentials reflect semantic priming in an object decision task. Brain Cogn 1994 Mar;24(2):259-76.
Jasper H. H., Report of the committee on methods of clinical examination in electroencephalography: The ten twenty system of the international federation, Electroencephalography and clinical neurophysiology. 1958, 10: 370-375.
Jenness, D. Auditory evoked-response differentiation with discrimination learning in humans. J. Comp. Physiol. Psychol. 1972 Jul; 80(1): 75-90.
Johnson-R, Jr., and Donchin, E. On how P300 amplitude varies with the utility of the eliciting stimuli. Electroencephalogr Clin Neurophysiol 1978 Apr;44(4):424-37.
Johnson-R, Jr., and Donchin, E. Second thoughts: Multiple P300s elicited by a single stimulus. PSYCHOPHYSIOLOGY. 1985. 22:2 182-194.
Johnson-R, Jr., and Donchin, E. Sequential expectancies and decision making in a changing environment: an electrophysiological approach. Psychophysiology 1982 Mar;19(2):183-200
Lopes da Silva, F. Neural mechanisms underlying brain waves: from neural membranes to networks. Electroencephalogr. Clin. Neurophysiol. 1991, 79, 81-93.
Papkostopoulos, D., Stamler, R., and Newton, P. Movement-related brain macropotentials during self-paced skilled performance with and without knowledge of results. In: W.C. McCallum, R. Zappoli, and F. Denoth (Ed.). Cerebral Psychophysiology: Studies in Event-Related Potentials. Electroenceph. Clin. Neurophysiol. , Suppl. 39. Elsevier Amsterdam. 1980: 261-262.
Perrault N, Picton TW. Event-related potentials during a problem solving task. Prog Brain Res. 1980;54:314-21.
Poon LW, Thompson LW, Williams RB Jr, Marsh GR. Changes of antero-posterior distribution of CNV and late positive component as a function of information processing demands. Psychophysiology 1974 Nov;11(6):660-73.
Ravden D, Polich J. Habituation of P300 from visual stimuli. Int J Psychophysiol 1998 Nov;30(3):359-65.
Ruchkin DS, Munson R, Sutton S. P300 and slow wave in a message consisting of two events. Psychophysiology 1982 Nov; 19(6): 629-42.
Ruchkin DS, Sutton S, Kietzman ML, Silver K. Slow wave and P300 in signal detection. Electroencephalogr Clin Neurophysiol 1980 Oct, 50 (1-2): 35-47.
Ruchkin DS, Sutton S, Munson R, Silver K, Macar F. P300 and feedback provided by absence of the stimulus. Psychophysiology 1981 May; 18 (3) :271-82
Ruchkin DS, Sutton S, Stega M. Emitted P300 and slow wave event-related potentials in guessing and detection tasks. Electroencephalogr Clin Neurophysiol 1980 Jul; 49(1-2): 1-14.
Stuss DT, Toga A, Hutchison J, Picton TW. Feedback evoked potentials during an auditory concept formation task. Prog. Brain Res. 1980; 54:403-9
Stuss, DT and Picton, T.W. Neurophysiological correlates of human concept formation. Behav. Boil, 1978, 23: 135-162.
Warren CA, McDonough BE. Positive event-related potentials to real and dummy rule learning. Feedback and to perceptuomotor feedback. Electroencephalogr Clin Neurophysiol 1995 Jan; 94(1): 60-79.
Garcia-larrea et al 1998
FIGURES AND TABLES
Button press usually
-500msec -200msec 0msec 600msec : 1000msec 2000msec
Screen Averaging Pattern Decision Feedback Pattern off
start appears A or B Correct or Screen
Incorrect Averaging stop
Figure (1)
-500msec -200msec 0msec 2000msec
Screen Averaging Pattern Pattern off
start appears Screen
Averaging stop


 x10
x10
![]()
![]()
Figure (4) shows The learning curve and the subjects performance -the learners (n=18) and the non-learners (n=16)- Y-axis represents subjects performance percentage, and X-axis represents the task of 200 trials.
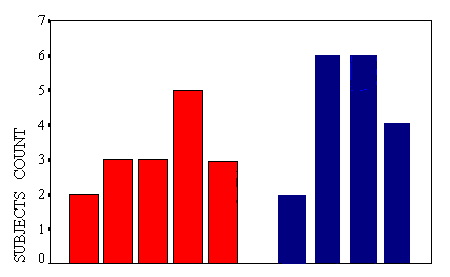
Figure (5) shows . Y-axis represents the subjects number, and X-axis represents them performance percentage during the learning task.
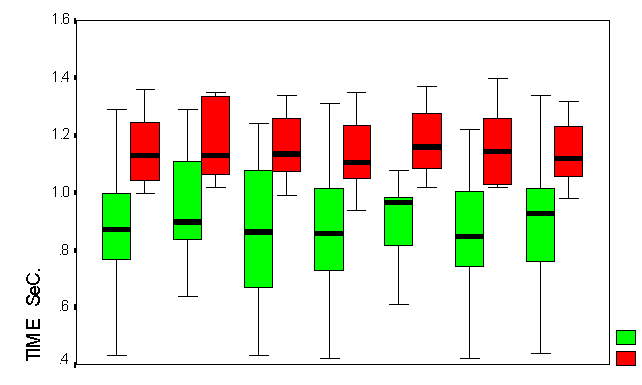
Figure (6) Box Plot chart shows the decision time in both groups
Y-axis represents decision time in milliseconds, and X-axis represents both group during the task
1) The average decision time for all trials in both group
2) The average decision time for first fifty trials in both group
3) The average decision time for last fifty trials in both group
4) The average decision time for correct trials in both group
5) The average decision time for incorrect trials in both group
6) The average decision time for type A trials in both group
The average decision time for type B trials in both group
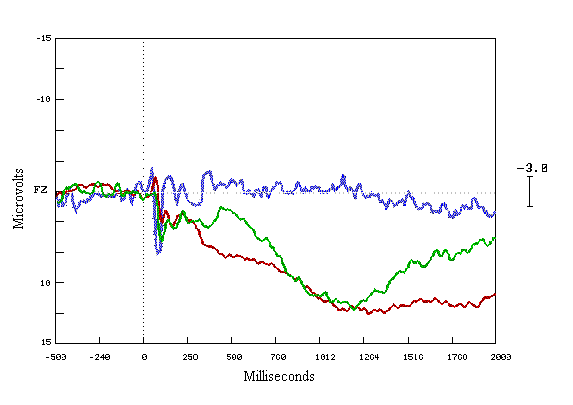
Figure (8) Grand average ERPs elicited by all subject’s performance in all groups (learners in red colour, non-learners in green colour, and observers in blue colour), recorded from mid-frontal site electrode (FZ), during the last fifty trials of the learning task.
Y-axis shows amplitude in Microvolts (m n ), X-axis shows latency in milliseconds (msecs). The dotted line marks the point of stimulus onset.
Positivity represented downward, and negativity upward.
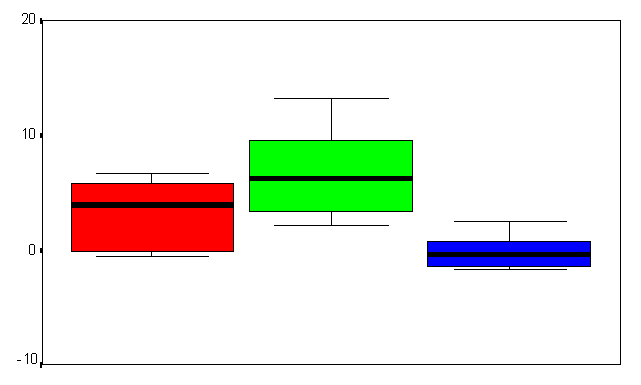
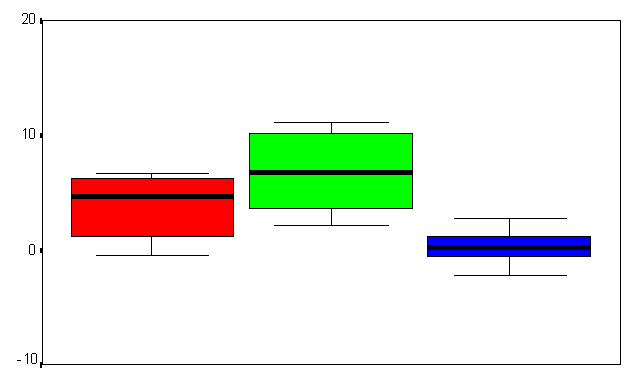
Figure (9a&b) Box plot chart shows the of brain evoked potentials during the last fifty trials during (A) the first time window (200-500 msec), and (B) the second time window (500-800 msec) at FZ refers to the frontal midline electrode. Y-axis represents the amplitude mean value and standard deviation in MicroVolts.
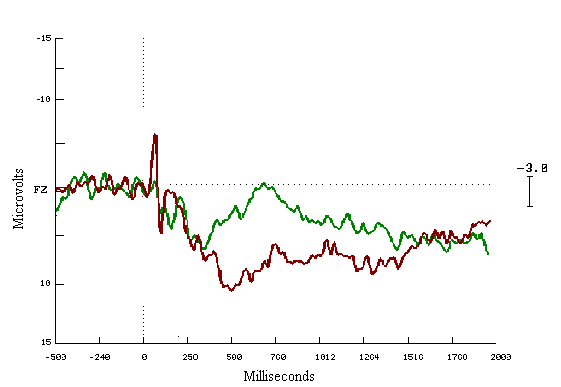
Figure (10)
Grand average ERPs for the last
fifty in the both groups
The learners = Red
The non-learners = Green
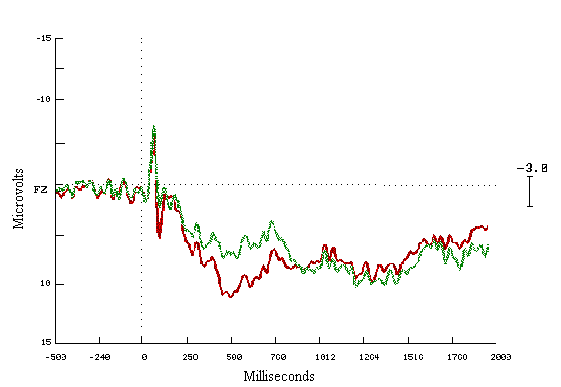
Figure (11)
Grand average ERPs for the first
& the last Fifty in the learners group
The first Fifty = Green
The last Fifty = Red
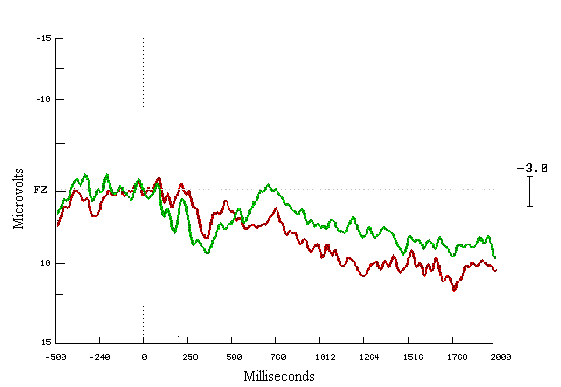
Figure (12)
Grand average ERPs for the First
& the Last Fifty in the non-learners group
The First Fifty = Red
The last Fifty = Green
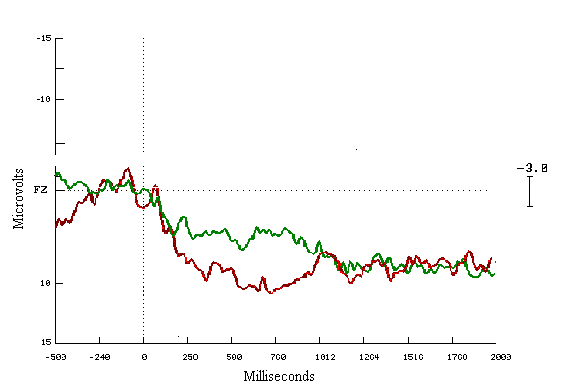
Figure (13)
Grand average ERPs for Correct
in the both groups
Learners = Red
Non-learners = Green
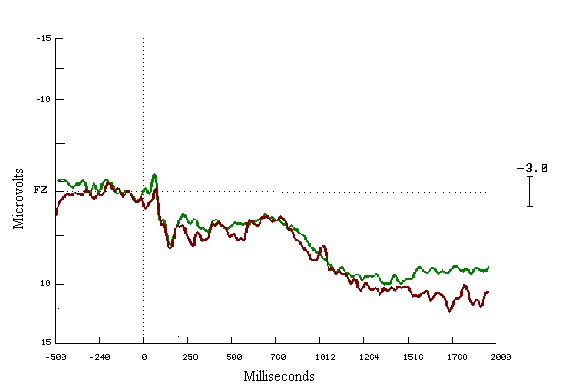
Figure (14)
Grand average ERPs for Incorrect
in the both groups
Learners = Red
Non-learners = Green
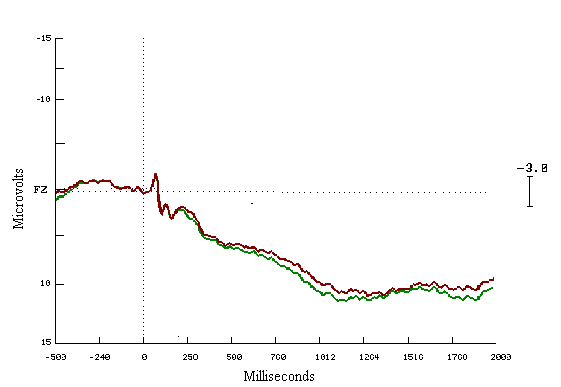
Figure (15)
Grand average ERPs for all waves
in the learners group
Pattern A = Red
Pattern B = Green
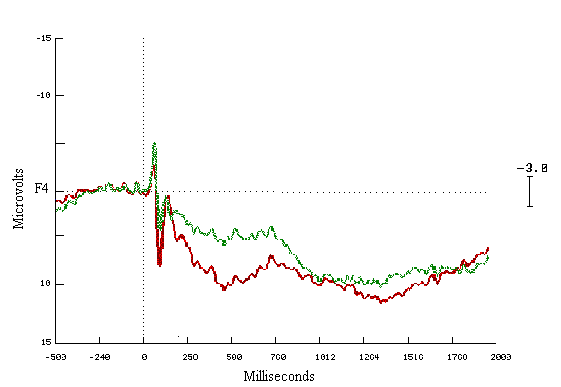
Figure (16)
Grand average ERPs for all waves
in the Learners group
Right side (F4) = Red
Left side (F3) = Green
| Electrode Locations | Mean of paired differences | Probability of First Time Window. | Mean of paired differences | Probability of second Time Window. |
| C4 - C3 | 1.145 * | 0.001 | 1.657 * | 0.007 |
| F4 - F3 | 0.674 * | 0.007 | 1.732 * | 0.003 |
| F8 - F7 | 1.904 * | 0.001 | 1.773 * | 0.001 |
| O2 - O1 | 0.506 | 0.061 | 0.631 | 0.078 |
| P4 - P3 | 0.665* | 0.009 | 0.549 * | 0.012 |
| TPR - TPL | 0.021 | 0.935 | 0.447 | 0.481 |
| T4 - T3 | 0.073 | 0.672 | 0.431 | 0.561 |
| T6 - T5 | 0.407 | 0.092 | 0.792 | 0.234 |
| ATR - ATL | 0.343 | 0.098 | 0.331 | 0.183 |
| Electrode Locations | Mean of paired differences | Probability of first Time Window. | Mean of paired differences | Probability of second Time Window. |
| C4 - C3 | 0.125 | 0.30 | 0.614 | 0.41 |
| F4 - F3 | 0.058 | 0.95 | 0.155 | 0.93 |
| F8 - F7 | 1.600 | 0.07 | 1.837 | 0.09 |
| O2 - O1 | 1.000 | 0.23 | 0.627 | 0.59 |
| P4 - P3 | 0.550 | 0.28 | 0.895 | 0.54 |
| TPR - TPL | 0.445 | 0.68 | 0.970 | 0.75 |
| T4 - T3 | 1.030 | 0.09 | 0.545 | 0.47 |
| T6 - T5 | 1.370 | 0.17 | 1.223 | 0.21 |
| ATR - ATL | 1.631 | 0.16 | 1.333 | 0.26 |
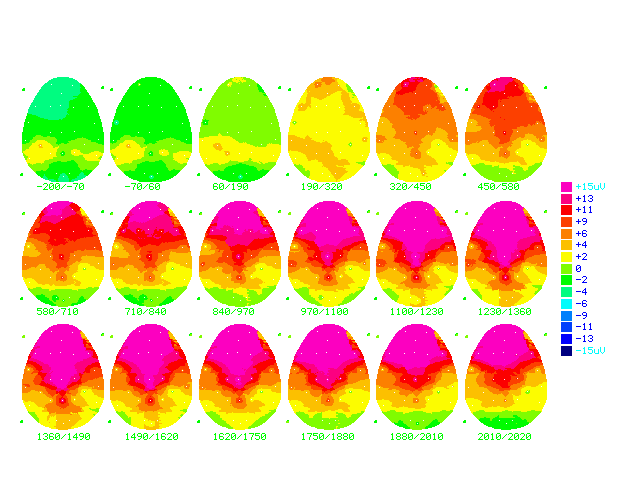
Figure (17a)
Cartoon brainmaps made from grand
average ERPs of all answers in the learning group (n=18)
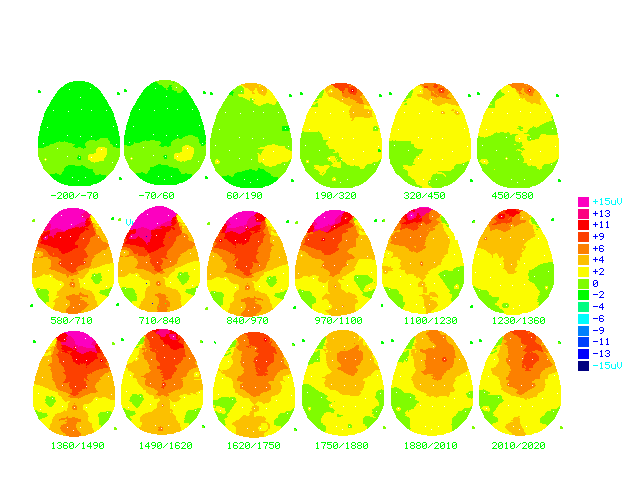
Figure (17b)
Cartoon brainmaps made from grand
average ERPs of all answers in the non-learning group (n=16)
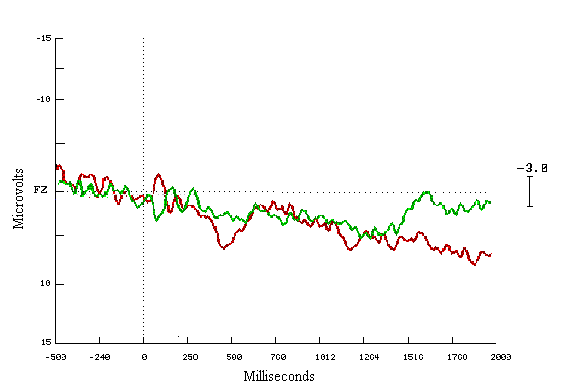
Figure (18)
Grand average ERPs subtraction
for all waves in the learners and the non-learners groups minus the observer
group
Non-learners minus observers = Green
Learners minus observers = Red
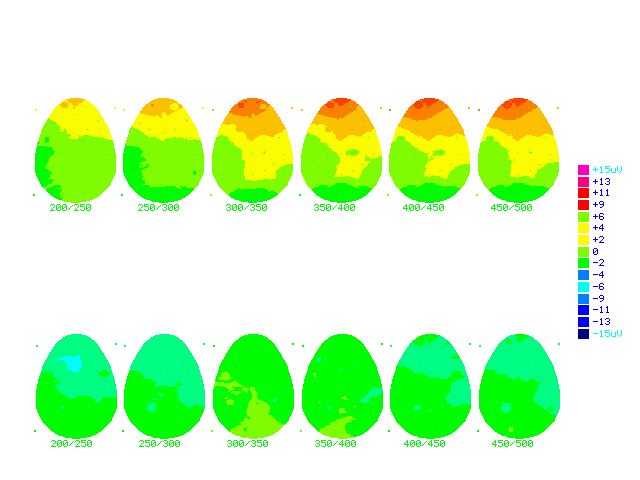
Figure (19a) Cartoon brainmaps made from grand average ERPs subtraction in both groups
Last fifty - First fifty during first time window 200msecs - 500 msecs
The numbers below each brainmap indicates the time in milliseconds when the map was computed. Colour scale displays Brain potentials from +15 mn in dark red, and –15 mn in dark blue.
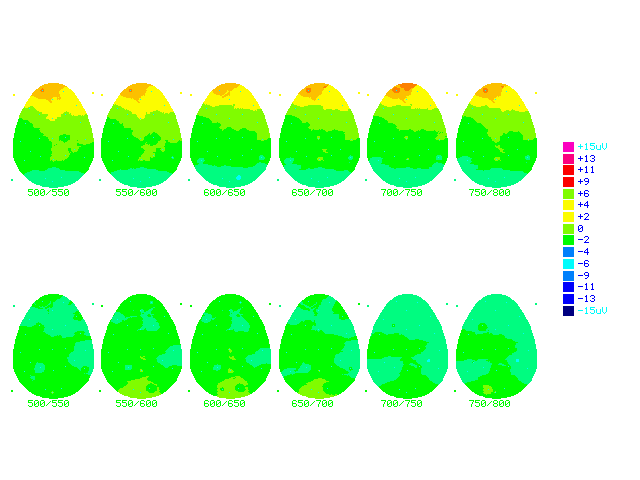
Figure (19b) Cartoon brainmaps made from grand average ERPs subtraction in both groups
Last fifty - First fifty during second time window 500msecs - 800 msecs
The numbers below each brainmap indicates the time in milliseconds when the map was computed. Colour scale displays brain potentials from +15 mn in dark red colour, and –15 mn in dark blue colour.