[ Previous ] [ Home ] [ Next ]

Written by: Ian Hickman
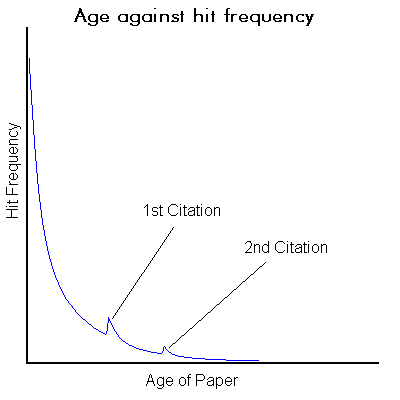
The Life Cycle of a paper
A paper starts its life when it gets deposited to the archive. At this point the paper will be downloaded as people are alerted to it. After some time, if the paper is of any quality other, authors will read it and cite it in their own paper. If these papers are then deposited in the archive the original paper will be downloaded further as people follow up the citations in these newer papers. (See below for histograom showing this predicted outcome)
The Distribution of Hits on Papers with one Citation
To test this hypothesis the set of all papers with one citation to them were extracted. Then of this set, a sub-set of papers that were deposited in the archive after 24th August was taken. The sub-set contained 18687 papers. If a paper from this sub-set was downloaded, the age of the hit was determined. Two data sets were produced with the no duplicate downloads set as its input. The sets produced were one of hits before the citation, and one of hits after the citation. The histograms are shown below.
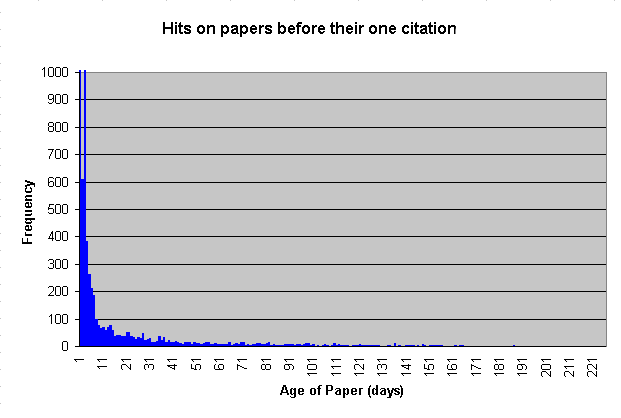
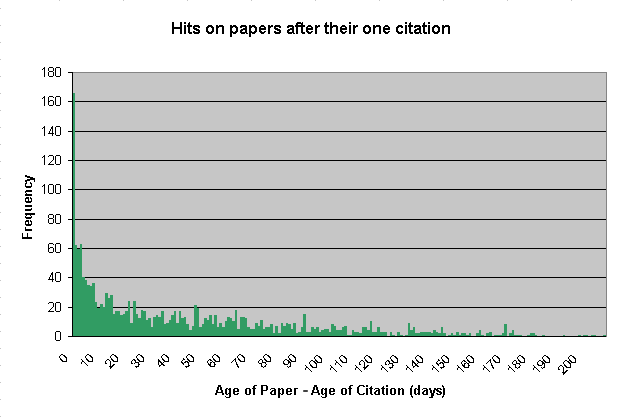
As you can see there is a peak at the start of the second graph, indicating that citations are followed up.
The Distribution of Hits on Papers with two Citations
The set of papers deposited after 24th August with two citations to them was extracted. The set contained 10086 papers. The same process as above was applied and the results are shown below.
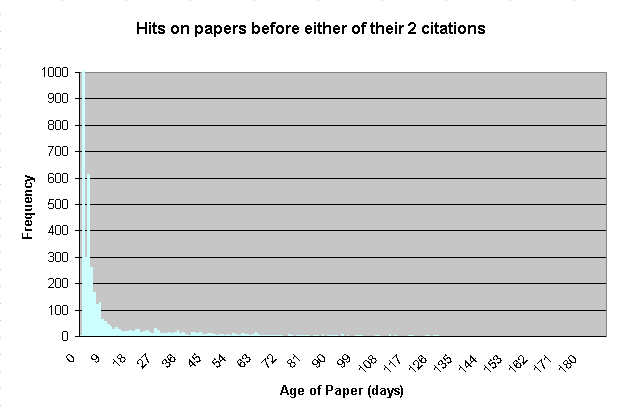
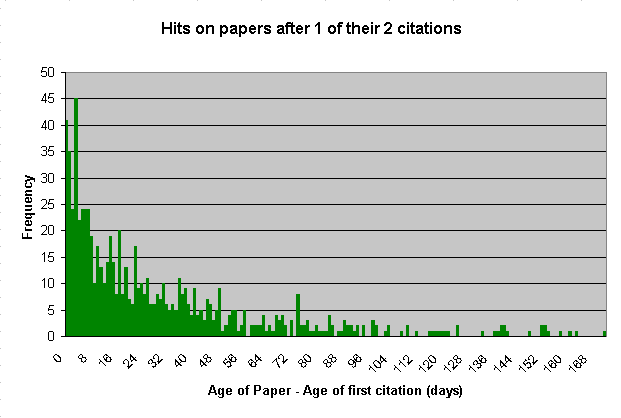
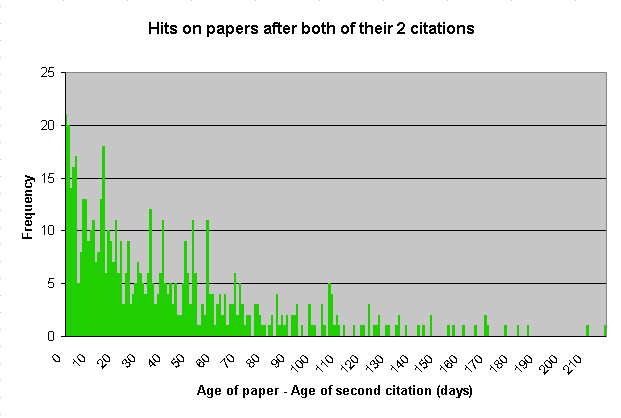
The graphs show again that citations are followed up, this is due to the peak at the start of the last two graphs.
For papers with both one or two citations there is a visible peak after the citations. This, however, doesn't take into account the age of the paper when it is cited.
How does the age effect the Distribution?
| Papers with 1 citation | Papers with 2 citations | ||
| 1st Citation | 1st Citation | 2nd Citation | |
| Average Age | 72.25 | 60.29 | 108.44 |
| Standard Deviation | 53.84 | 46.79 | 58.64 |
| Peak at Citation age 1 | 3 | 7 | 1 |
| Age equal to Citation 2 | 8 | 11 | 15 |
- This is the frequency before a citation, at the time just before the average citation age. This shows that there
is an increase in the number of hits, due to the citation.
- This is the age before a citation with a (roughly) equal number of hits to the citation peak
[ Previous ] [ Top ] [ Home ] [ Next ]