[ Previous ] [ Home ] [ Next ]

Written by: Ian Hickman
Amonaly Analysis.
This section tries to explain some of the anomalies in the collected data.
Why is there a peak in the "Time between downloads" graph?
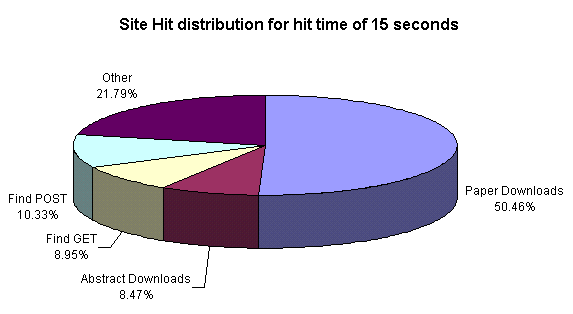
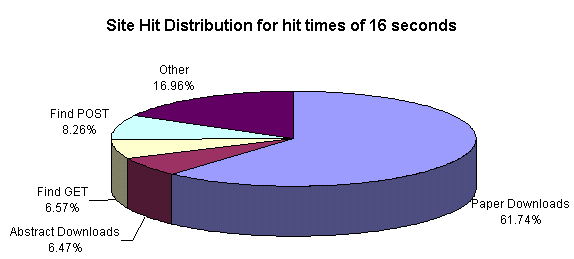
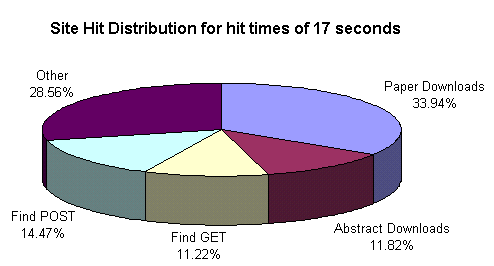
The peak is between 15 to 17 seconds. To understand this more fully the hit distribution of pages that were displayed for this length of time needs to be calculated. The log was split up into pages that were displayed for 15, 16 or 17 seconds. Then the hit distribution was calculated. The results are shown below.


In all three cases there is a higher percentage of paper downloads than in the general case. href="http://xxx.soton.ac.uk/ps/gr-qc/0006005">typical paper is 105000 bytes. To download the paper in 16 seconds a data rate of 105000/16 = 6562.5 bytes per second = 52.5K bits per second is required.

[ Previous ] [ Top ] [ Home ] [ Next ]