We're interested in developing novel ways to measure, visualise and optimise home energy use through the web and mobile device.
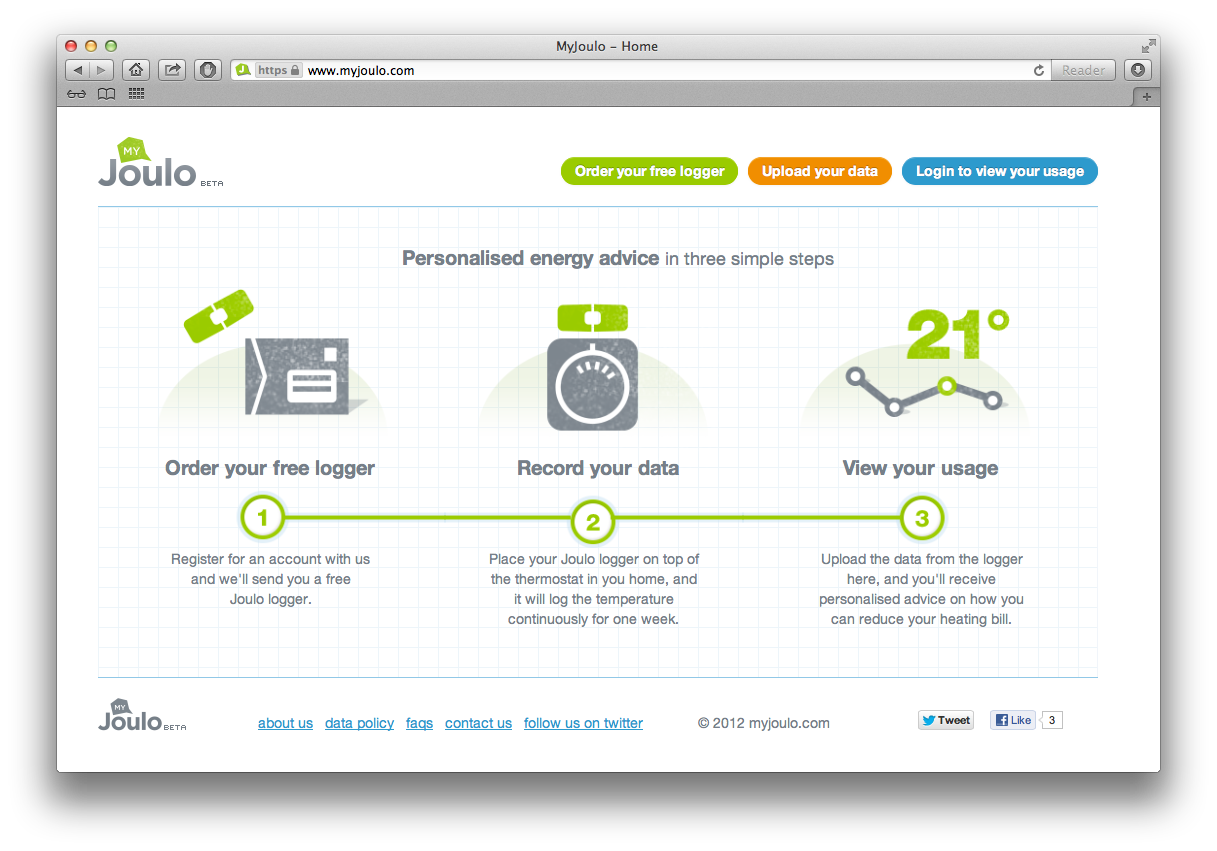
MyJoulo
Get personalised energy advice in three simple steps from MyJoulo.
 |
Energy Quiz
Test your energy intuition on the Energy Quiz.
 |
GridCarbon
Demand for electricity in the UK varies throughout the day, and thus, the mix of generators supplying this electricity continually changes. As a result, the carbon intensity of the electricity - the quantity of CO2 produced for 1 kWh of electricity consumed - also varies continually. Deferring your use of electricity to off-peak times, when the carbon intensity is low, can help reduce your carbon footprint.
 |
 |
GridCarbon uses up-to-date generation mix data made available by ELEXON. GridCarbon presents a summary of the generation mix data broken down into Gas (CCGT + OCGT), Coal (COAL), Nuclear (NUCLEAR), Wind (WIND) and Hydro (NPSHYD). This data is converted into a carbon intensity value by weighting the proportions from each generation type using the values below.
| Symbol | Fuel Type | Carbon Intensity (gCO2/kWh) |
| CCGT | Closed cylce gas turbine | 360 |
| OCGT | Open cylce gas turbine | 480 |
| COAL | Coal | 910 |
| NUCLEAR | Nuclear | 0 |
| WIND | Wind | 0 |
| PS | Pumped storage | 0 |
| NPSHYD | Non-pumped storage hydro | 0 |
| OTHER | Other | 300 |
| OIL | Oil | 610 |
| INTFR | French Interconnector | 90 |
| INTIRL | Irish Interconnector | 450 |
| INTNED | Dutch Interconnector | 550 |
| INTEW | East-West Interconnector | 450 |
Finally, the resulting figure is multiplied by 1.07 in order to reflect the losses in the transmission and distribution networks.
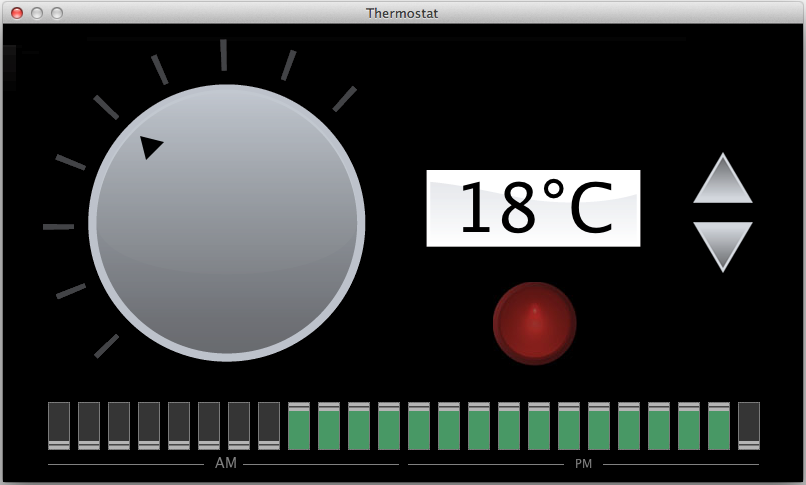
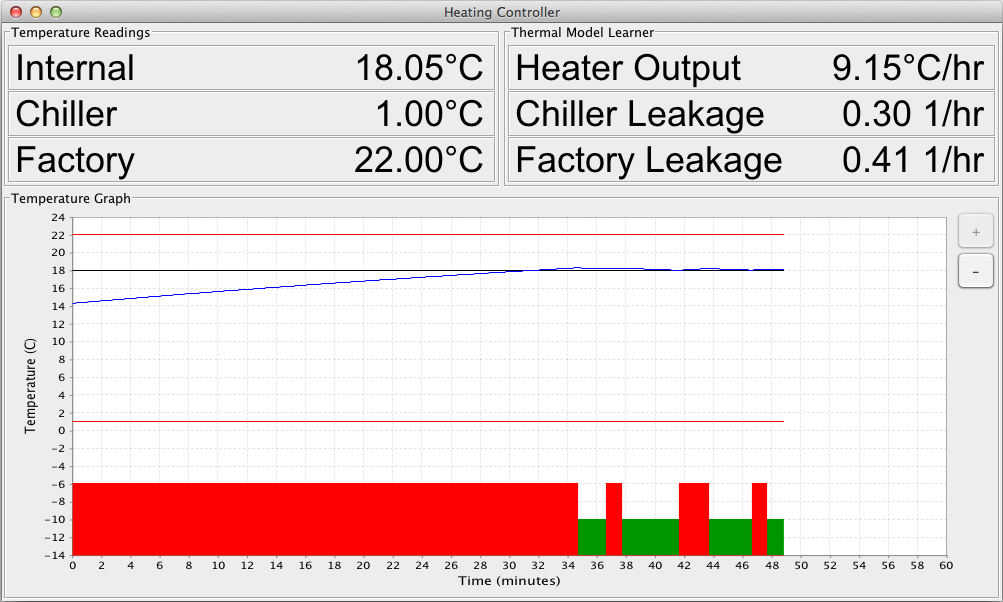
Thermostat Control
To test the algorithms developed within the project we have implemented a thermostat with a time proportional intergral controller (interfacing with Zigbee temperature sensors and power switches) that learns the thermal properties of the system that it is controlling. These properties can then be used to optimise heating start times, or to perform demand side management of heating loads:
 |
 |