SLE Dashboard
Start date: 01/02/2011
End date: 31/07/2012
Funded by:

End date: 31/07/2012
Funded by:
Context
- At the University of Southampton we are currently implementing major changes to our environment for supporting students in all aspects of the student lifecycle. An important aspect of these changes, which are as a whole known as the "Curriculum Innovation Project", is having the idea to support both living and learning at the core of our thinking.
- These changes have come about as a result of a number of initiatives over the past three years, including participation in HEA E-Learning Benchmarking, analysis of the NSS survey, a major internal survey carried out with the aid of our student.s union and in particular our participation in the HEA Enhancement Academy.
- Our HEA enhancement academy team met in summer 2009 and included the PVC (Education), the Director of Information Services (iSolutions), the Librarian, the Director of the Learning and Teaching Enhancement Unit and was led by the University Director of Education (TEL) - Hugh Davis, who is the proposer for this project. Professor Terry Mayes was, and continues to be, our critical friend. The outcome of this activity was the inception of the "Curriculum Innovation Project" in October 2010. The outcomes of this work are now embedded in the new University strategy and reflected in our new structures, including two boards that are of particular relevance to this bid: the Technology Enhanced Learning and Living Board (TELL Board, chaired by Hugh Davis) and the CRM Systems Board (Chaired by the Director of Computer Services, Janice Rippon).
- As part of this work the University of Southampton currently holds a JISC Grant to prototype the "Southampton Learning Environment (SLE)" under the Distributed VLE programme. This grant is providing support to the University to adopt an agile development approach in order to prototype parts of a large and costly (7 figure budget) environment to support living and learning. The SLE is intended to be innovative and student-centred, creating a space to develop novel ideas at the institutional level.
- In this project we propose to adopt the same agile and user-led approach to prototype significant changes to the CRM systems that Student Services uses to support the student experience.
- The University currently supports a range of RM systems (finance, student services, academic records, graduate passports, funding and fees, etc.). These systems are implemented on a range of software systems and provide a partial and disjointed view to the students, tutors and admin staff who access them. The main focus of this project is to create a SLE Dashboard that provides a sense-making window onto this disparate data for a range of stakeholders, including students and tutors. This will dramatically increase the transparency of information held by the University, integrate with the broader SLE Environment and act as a driver of change for the University's RM processes.
- In addition to this main goal part of the purpose of this project would be to experiment with a proposed move from Oracle CRM to Microsoft Dynamic CRM, which would then enable .NET integration with the remainder of the SLE front end that is being implemented in SharePoint 2010.
- Our key aim is to integrate information about our students that is currently held in a range of different places, in order to improve the quality of service, mentoring and tutoring that we provide for our students, with the objective of improving progression and retention and reducing non-completion.
Project Description
- Student Services currently operate a RM system that maintains information on individual students. The information that is collected is the record of interactions that members of student services staff have with students when they visit the student services building, or by email. However there are many other pieces of information that are held in separate systems, which would be relevant to a person interacting with a student. And there are many people who deal with students who would benefit from access to this total pool of information or part of it. For example tutors, mentors, faculty staff, student support services etc.
- The challenge for this project is to agree on the design of a new RM which not only continues to provide the existing facilities but also integrates the information we have from various sources in a "Student Dashboard", which will provide appropriate information about students to appropriate staff, which will enable appropriately authorised users to update or add new information, and will also provide a one stop shop to enable the student to check information held by the institution about them, while allowing them to update it where appropriate or otherwise telling them who to contact if they feel it is inaccurate.
- Our intention for the Student Dashboard is to provide a cultural shift to a student focussed system that is transparent and improves access to services and improves the co-ordination of services to improve the student's experience of learning and living at the University of Southampton.
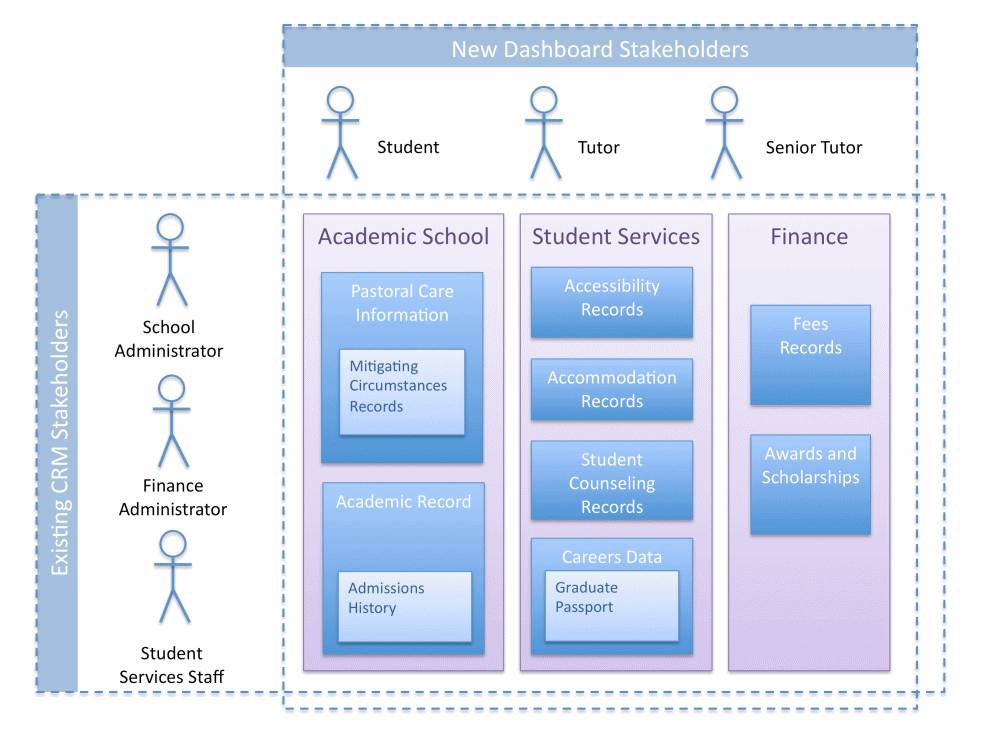
Figure 1 Stakeholders and Services in the Student Dashboard.
- Clearly an important aspect of this work will be to tie in with the ID management system so that the system knows the role of the person viewing any student.s record, and this the appropriate level of information that can be made available.
- The following is a fictionalised scenario that describes a real problem encountered by a University of Southampton academic.
"Jonathan is a Senior Academic and Tutor at the University of Southampton. One of his first-year tutees, Andy, is having a problem with his fees and as a result the central University finance department has followed standard procedure and issued a warning letter to Andy and a notice to the School to terminate Andy's studentship if payment is not forthcoming. Andy is in halls and the Accommodation office is also alerted to the situation. In fact it is the fault of the Student Loans Company that the fees are late and Andy was not aware that there was a problem until he received notification from the University. He is worried and upset at being caught in the large University machine and brings the matter to Jonathan's attention and asks for help. Unfortunately Jonathan is unable to easily find out the status of Andy's studentship, the status of his fees payment or his accommodation situation without liaising with three separate administrative departments, all of which have only part of the picture. As a result it takes several weeks to untangle the situation, during which Andy receives several more alarming warning letters about his studentship and accommodation.
While the situation described here was resolved in the end, the student experience was very poor, with several weeks of uncertainty and confusion as the various University departments came to understand that the fault did not lie with the student. It did not help that the student's primary contact, his personal tutor, was not in the communications loop and had to work hard to understand the full situation.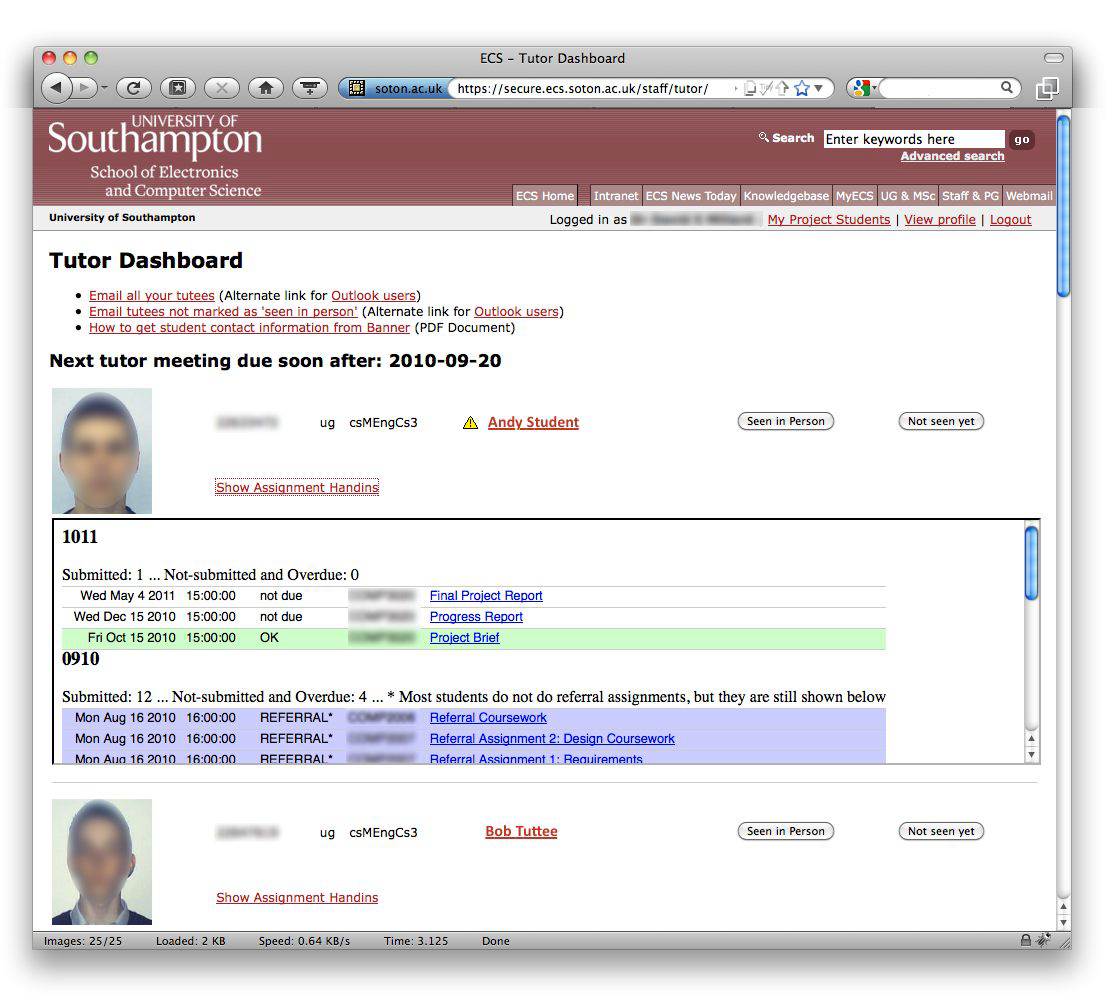
Figure 2, an example of a dashboard showing loosely coupled integration of services and the surfacing of data.
- An example of the kind of dashboard we envision is the recently deployed University of Southampton School of Electronics and Computer Science "Tutor Dashboard" which brings together a number of heterogeneous systems to provide the tutor with a window on his tutees. academic activities. For example: submitted coursework, late coursework, and the student's contact details. This enables the tutor to have constructive meetings with his tutees, informed by information about the student's progress. The information available in this dashboard is limited. The Southampton Student Dashboard will integrate information from many more systems.
- The aim of the project is to create and deploy a demonstrator of the student dashboard that can be piloted with a cohort of students from September 2011. This will enable us to evaluate the impact of making data from heterogeneous systems available and open and interactions transparent to a range of stakeholders. The pilot phase will be used to examine the service improvements that may be possible to provide a blueprint for institutional change.
- The key deliverables are the Student Dashboard Demonstrator itself, the models and service analysis that informed the dashboard, the case study and mixed method evaluation. These deliverables will:
- Improve the student experience of interacting with the University of Southampton's services.
- Enable stakeholders to offer a better informed service and support to students with the knowledge of other interactions that the student has taken part in.
- Provide a vehicle to discover service innovations that will improve the student experience of living and learning at the University of Southampton.
- Demonstrate the value of enterprise modelling and develop the modelling capability within the institution.
- These deliverables are focussed on improving the student experience with the aim of improving progression and retention and reducing non-completion. This will be achieved as those interacting with students (student services' staff, personal tutors, counsellors and other academics) will have a complete view of what the institution knows about the student. This will enable them to spot early signs of the patterns that we know lead to problems and eventually to drop-out or failure to progress, and once these signs have been noted it is possible to make timely interventions. Although not within the scope of this project, it would be possible to build an intelligent agent to spot these patterns automatically.