Web Science Institute Research Week (Part II)
During the week of the 24th - 28th February, the Web Science Institute at the University of Southampton hosted a research week for Web Science students and academics, industry contacts, and other interested academics in the University. We split in to groups around a list of topics and worked in teams to develop research projects around them. This post is about the Historical Analysis of Government Websites group with the National Archives and is part 2 of a series detailing our motivations, developments and outputs. Part 1 is available here. A storify from the point of view of our group is also available here.
Step 2: Project Development
We had decided early in the week to focus on "Spin" as a phenomenon to be explored on governmental websites from the National Archives. We wanted to explore the frequency of terms used on web pages over time around the concept of a particular event or narrative. We chose the financial crisis and selected a set of terms to reflect this: inflation, wage and unemployment.
The aim was to track the popularity of these terms on government websites in comparison to real measures of their values from external data sources - for example, if the average wage increases, how much does the the word 'wage' increase on government web pages to reflect this?
“@sotonWSI: National Archive has 100TB of data on history of Government Websites - @_ianbrown #websciresweek” < finding ways to analyse this
— Chris Phethean (@cpheth) February 27, 2014 There were a number of ways to access the data from the National Archives, we utilised an API that returns an RSS feed of pages matching a given search term. Using R, we accessed, processed and then visualised the data received. There were some delays in getting this all *completely* working, but we were able to produce proof-of-concepts that showed how a reusable and generic analyser/visualiser for the National Archives would work, along with working scripts that collected and processed the data.
It was a very positive experience and as a team we believe that the working relationship with the National Archives is extremely important. It has been great to feel like we've established a generic method for analysing the data returned by their API - it was a priority right from day 1 that we all agreed on that we wanted to create something that would live on and be useful after this week ended, rather than just hack something together for some results on the final day.
 |
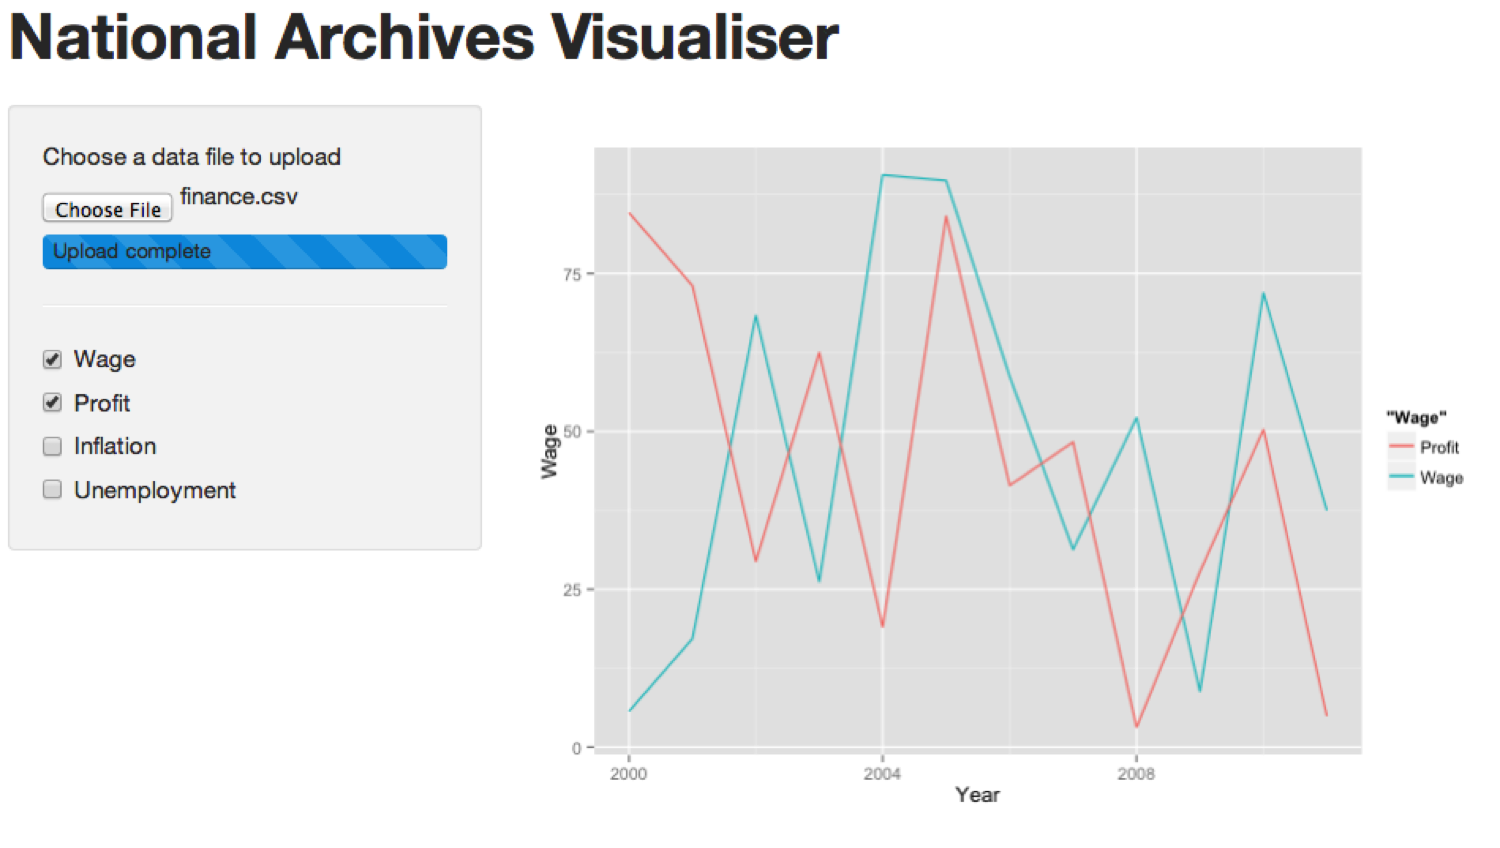
| Mock UI for the trend visualiser - Note this is completely dummy data and does not reflect actual use of these terms. |
It was a very positive experience and as a team we believe that the working relationship with the National Archives is extremely important. It has been great to feel like we've established a generic method for analysing the data returned by their API - it was a priority right from day 1 that we all agreed on that we wanted to create something that would live on and be useful after this week ended, rather than just hack something together for some results on the final day.
#websciresweek #teamnationalarchives ready to present! pic.twitter.com/Q5L1aWSnLZ
— Chris Phethean (@cpheth) February 28, 2014 We visited the Royal Society in London on the Friday, where along with the other research groups, we presented the outcomes of the project. It all ended very positively, and it was nice to see that while we had considered Plans B, C and D, we eventually stuck with the original Plan A and made real progress towards getting something extremely worthwhile produced. Being such a rich data source, this was an invaluable step towards a potentially invaluable research tool for analysing historical and political events.@_ianbrown @cpheth Great work #teamnationalarchives! Thought your work this week was great. Hope to pick it up with you again soon! #wsirs
— Simon Demissie (@Baloun) February 28, 2014